Ch. 4 - Inverse, Exponential, and Logarithmic Functions
Lial - College Algebra 13th Edition
Lial13th EditionCollege AlgebraISBN: 9780136881063Not the one you use?Change textbook
Chapter 5, Problem 31

Graph each function. See Example 2. ƒ(x) = (3/2)x

Verified step by step guidance
1
Identify the type of function given. Since the function is ƒ(x) = \(\left\)(\(\frac{3}{2}\)\(\right\))^x, it is an exponential function with base \(\frac{3}{2}\), which is greater than 1, indicating exponential growth.
Create a table of values by choosing several values for x (for example, -2, -1, 0, 1, 2) and calculate the corresponding y-values using the function ƒ(x) = \(\left\)(\(\frac{3}{2}\)\(\right\))^x. Remember to apply the exponent rules carefully.
Plot the points from the table on the coordinate plane. Each point will have coordinates (x, ƒ(x)) based on your calculations.
Draw a smooth curve through the plotted points, making sure the graph approaches the x-axis but never touches it (this is the horizontal asymptote y = 0), and that the curve increases as x increases because the base is greater than 1.
Label the graph with the function equation and the asymptote y = 0 to clearly show the behavior of the exponential function.

Verified video answer for a similar problem:

This video solution was recommended by our tutors as helpful for the problem above.
Video duration:
5m
Was this helpful?

Key Concepts

Here are the essential concepts you must grasp in order to answer the question correctly.

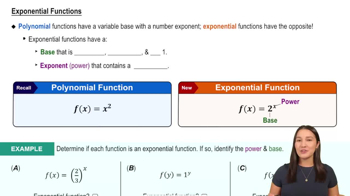
Exponential Functions

An exponential function has the form f(x) = a^x, where the base a is a positive constant not equal to 1. It models growth or decay processes, and its graph shows rapid increase or decrease depending on the base. Understanding the behavior of exponential functions is essential for graphing them accurately.
Recommended video:
6:13
Exponential Functions

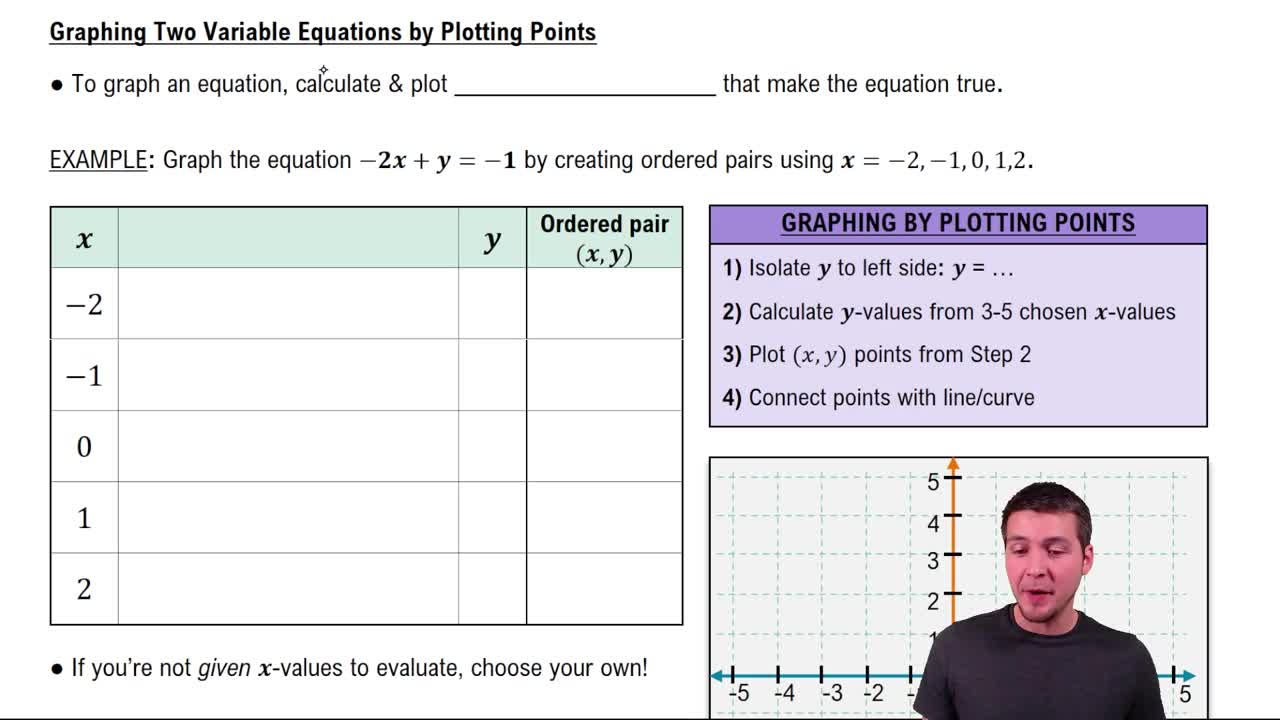
Plotting Points for Graphing

To graph a function like f(x) = (3/2)^x, calculate and plot points by substituting various x-values and finding corresponding y-values. This helps visualize the curve and identify key features such as intercepts and growth trends. Plotting points is a fundamental step in graphing any function.
Recommended video:
Guided course
04:29
Graphing Equations of Two Variables by Plotting Points

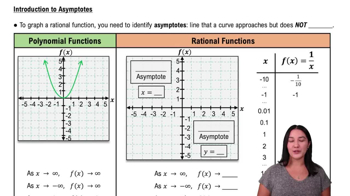
Asymptotes and End Behavior

Exponential functions have a horizontal asymptote, usually the x-axis (y=0), which the graph approaches but never touches. Understanding this helps predict the function's behavior for large positive or negative x-values, showing how the function grows or decays without bound.
Recommended video:
6:24
Introduction to Asymptotes