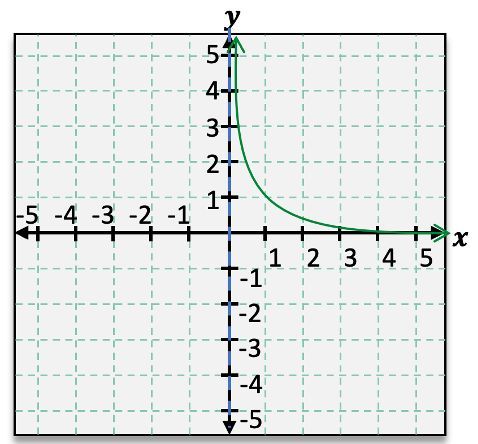
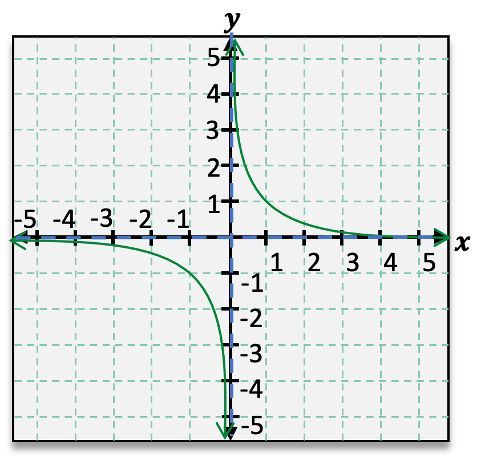
When analyzing rational functions, understanding asymptotes is crucial for accurately graphing these functions. Asymptotes are lines that the graph approaches but never touches, providing insight into the function's behavior at extreme values. For instance, consider the rational function \( f(x) = \frac{1}{x} \). This function exhibits both horizontal and vertical asymptotes.
To identify the horizontal asymptote, we observe the behavior of the function as \( x \) approaches infinity or negative infinity. In this case, as \( x \) approaches infinity, \( f(x) \) approaches 0, indicating a horizontal asymptote at \( y = 0 \). Similarly, as \( x \) approaches negative infinity, \( f(x) \) also approaches 0. This behavior can be expressed using limit notation: \( \lim_{x \to \infty} f(x) = 0 \) and \( \lim_{x \to -\infty} f(x) = 0 \).
Next, we examine the vertical asymptote, which occurs where the function is undefined. For \( f(x) = \frac{1}{x} \), the function is undefined at \( x = 0 \). As \( x \) approaches 0 from the right, \( f(x) \) approaches positive infinity, while from the left, it approaches negative infinity. This can be denoted as \( \lim_{x \to 0^+} f(x) = \infty \) and \( \lim_{x \to 0^-} f(x) = -\infty \). The vertical asymptote is represented by the dashed line \( x = 0 \).
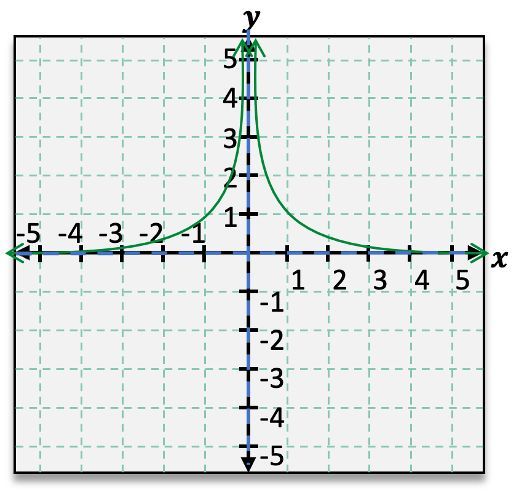
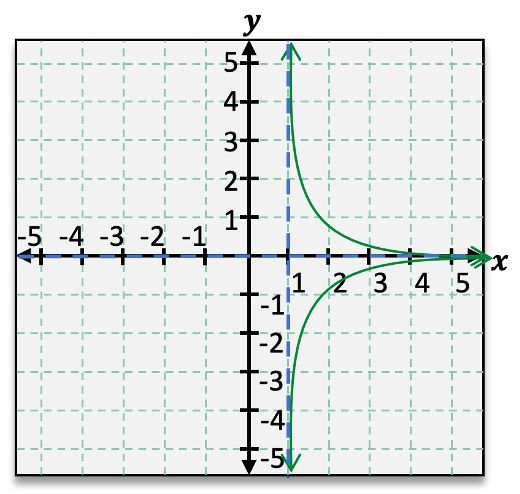
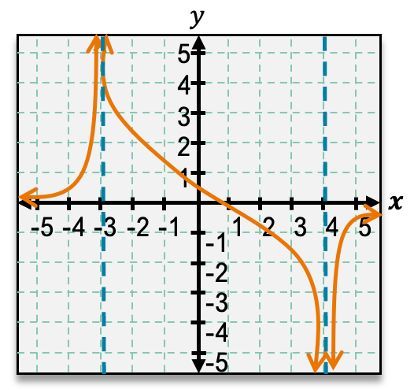
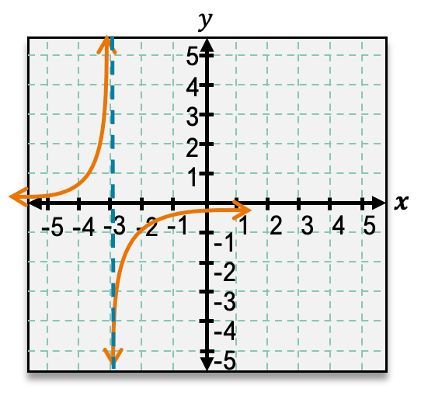
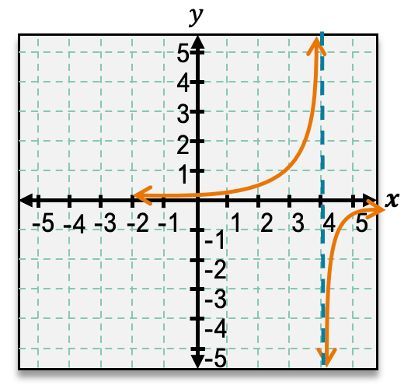
Rational functions can have various configurations of asymptotes. Some may have no asymptotes, while others can have one or multiple vertical and horizontal asymptotes. The presence and location of these asymptotes depend on the specific function being analyzed. Understanding these concepts is essential for graphing rational functions effectively and interpreting their behavior accurately.