

 02:19
02:19
Textbook Question
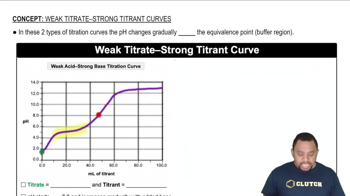
The graphs labeled (a) and (b) show the titration curves for two equal-volume samples of monoprotic acids, one weak and one strong. Both titrations were carried out with the same concentration of strong base.
(i) What is the approximate pH at the equivalence point of each curve?
864
views