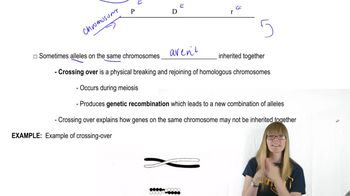
Pearson+ LogoPearson+ Logo
Ch. 5 - Genetic Linkage and Mapping in Eukaryotes
Sanders - Genetic Analysis: An Integrated Approach 3rd Edition
Sanders3rd EditionGenetic Analysis: An Integrated ApproachISBN: 9780135564172Not the one you use?Change textbook
Chapter 5, Problem 37

For six genes known to be linked on chromosome 10 of corn (Zea mays), the recombination frequencies between various pairs have been determined in a series of genetic crosses. Use the recombination frequency data in the table below to determine the order of and distance between the genes on a genetic map. The gene lc1 is known to be closest to the telomere of the chromosome.
Table displaying recombination frequencies for six linked genes on corn chromosome 10, aiding in genetic mapping.

Verified step by step guidance
1
Start by understanding that recombination frequency is used to estimate the genetic distance between genes. A recombination frequency of 1% corresponds to 1 map unit (centimorgan, cM). Genes with lower recombination frequencies are closer together, while those with higher frequencies are farther apart.
Since the gene lc1 is known to be closest to the telomere, use it as the starting point for constructing the genetic map. Identify the gene with the smallest recombination frequency relative to lc1, as this gene is likely the next closest on the chromosome.
Continue adding genes to the map by iteratively selecting the gene with the smallest recombination frequency relative to the most recently placed gene. Ensure that you account for all pairwise recombination frequencies to maintain consistency in the map.
Calculate the cumulative distances between genes as you place them on the map. For example, if gene A is 5 cM from gene B, and gene B is 10 cM from gene C, the total distance from gene A to gene C is 15 cM.
Once all genes are placed, verify the map by checking that the sum of recombination frequencies between adjacent genes matches the recombination frequencies between non-adjacent genes. Adjust the map if necessary to ensure consistency with the data.

Verified video answer for a similar problem:

This video solution was recommended by our tutors as helpful for the problem above.
Video duration:
2m
Was this helpful?

Key Concepts

Here are the essential concepts you must grasp in order to answer the question correctly.

Recombination Frequency

Recombination frequency is a measure of the likelihood that two genes will be separated during meiosis due to crossing over. It is expressed as a percentage, representing the proportion of recombinant offspring produced in a genetic cross. A higher recombination frequency indicates that genes are further apart on a chromosome, while a lower frequency suggests they are closer together.
Recommended video:
Guided course
03:51
Recombination after Single Strand Breaks

Genetic Mapping

Genetic mapping is the process of determining the relative positions of genes on a chromosome. This is achieved by analyzing recombination frequencies between pairs of genes, which allows researchers to create a linear representation of gene order and distances. Genetic maps are essential for understanding gene interactions and inheritance patterns.
Recommended video:
Guided course
11:11
Mapping Overview

Linkage and Linkage Groups

Linkage refers to the tendency of genes located close to each other on the same chromosome to be inherited together during meiosis. Genes that are linked form linkage groups, which can be mapped based on their recombination frequencies. Understanding linkage is crucial for predicting inheritance patterns and constructing accurate genetic maps.
Recommended video:
Guided course
07:33
Chi Square and Linkage
Related Practice
Textbook Question

Based on previous family studies, an autosomal recessive disease with alleles A and a is suspected to be linked to an RFLP marker. The RFLP marker has four alleles, R₁, R₂, R₃, and R₄. The accompanying pedigree shows a three-generation family in which the disease is present. The gel shows the RFLP alleles for each family member directly below the pedigree symbol for that person. After determining the genotypes for the RFLP and disease gene for each family member, answer the following questions.

Is there any evidence of recombination in this pedigree? If so, identify the recombinant individuals and illustrate the recombination that has occurred.

476
views
Textbook Question

Based on previous family studies, an autosomal recessive disease with alleles A and a is suspected to be linked to an RFLP marker. The RFLP marker has four alleles, R₁, R₂, R₃, and R₄. The accompanying pedigree shows a three-generation family in which the disease is present. The gel shows the RFLP alleles for each family member directly below the pedigree symbol for that person. After determining the genotypes for the RFLP and disease gene for each family member, answer the following questions.

Based on your analysis, what is the recombination frequency in this family? Explain how you obtained your answer.

456
views
Textbook Question

Divide a clean sheet of paper into four quadrants and draw one pair of homologous chromosomes in each quadrant. Draw the chromosomes with two sister chromatids each. The four sets of homologous pairs are identical. Label one chromosome of each pair with alleles A₁ and A₂ and the other member of each pair with the alleles A₁ and A₂. You are to illustrate a single crossover between the homologs in each quadrant and list the parental and recombinant chromosomes, but you are to illustrate four different ways the crossover can occur by involving different chromatids in each illustration.

452
views