The Chi Square test is a statistical method used to determine the likelihood that two genes are linked based on observed and expected values. This analysis is particularly relevant in genetics when assessing gene linkage, which refers to the tendency of genes located close to each other on a chromosome to be inherited together. The Chi Square formula is expressed as:
\(\chi^2 = \sum \frac{(O - E)^2}{E}\)
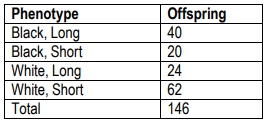
where \(O\) represents the observed values and \(E\) represents the expected values. To conduct a Chi Square test for gene linkage, one must first establish the expected numbers of offspring based on the assumption that the genes are not linked. For two unlinked genes, the recombination frequency is typically around 50%, meaning that if 50 offspring are produced, one would expect approximately 25 parental and 25 recombinant offspring.
In a practical example, if a cross between two heterozygous organisms yields 31 parental and 19 recombinant offspring, the expected values would be 25 parental and 25 recombinant. The next step involves calculating the Chi Square value using the observed and expected numbers. In this case, the calculation yields a Chi Square value of 2.88.
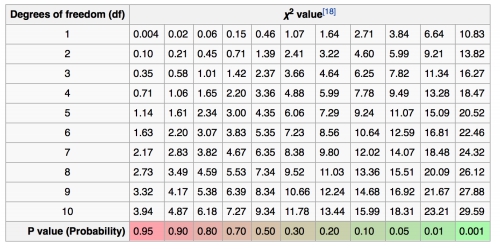
To interpret this value, one must determine the degrees of freedom, which in this scenario is calculated as the number of traits minus one. With two traits (parental and recombinant), the degrees of freedom is 1. Using a Chi Square distribution table, one can find the corresponding p-value, which indicates the probability of observing the data if the null hypothesis is true. In this case, the p-value falls between 0.05 and 0.10.
The null hypothesis posits that there is no significant difference between the observed and expected values, suggesting that the genes are not linked. Since the p-value is greater than 0.05, one would accept the null hypothesis, concluding that there is insufficient evidence to claim that the genes are linked. This analysis allows researchers to assert with 95% confidence that the genes are not linked, although it does not confirm linkage definitively. Further testing would be necessary to establish a more conclusive understanding of the genetic relationship between the two genes.