
Ch. 8 - Alkenes 1: Properties and Electrophilic Additions
Mullins - Organic Chemistry: A Learner Centered Approach 1st Edition
Mullins1st EditionOrganic Chemistry: A Learner Centered ApproachISBN: 9780137566471당신이 사용하는 게 아니라요?교과서 변경
7장, 문제 3

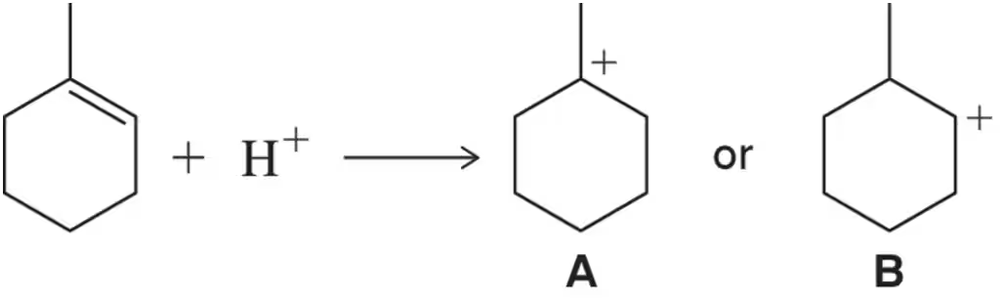
Given that A is more stable than B, draw a reaction coordinate diagram that rationalizes the fact that A forms more quickly than B in the following reaction.
Reaction coordinate diagram showing the formation of A and B, indicating A is more stable and forms more quickly than B.

검증된 단계별 안내
1
Understand the problem: The reaction coordinate diagram is a graphical representation of the energy changes during a chemical reaction. Since A forms more quickly than B, this suggests that the activation energy (Ea) for forming A is lower than that for forming B. Additionally, A is more stable than B, meaning A has a lower final energy than B.
Step 1: Draw the x-axis and y-axis of the reaction coordinate diagram. Label the x-axis as 'Reaction Progress' and the y-axis as 'Energy'.
Step 2: Represent the starting material (reactants) as a point on the y-axis at a certain energy level. This will be the same starting point for both pathways leading to A and B.
Step 3: Draw two curves starting from the reactants. The curve leading to A should have a lower peak (lower activation energy) compared to the curve leading to B. This reflects the fact that A forms more quickly than B.
Step 4: End the curve for A at a lower energy level than the curve for B. This indicates that A is more stable than B, as it has a lower final energy.
Step 5: Label the activation energy (Ea) for both pathways and the relative energy levels of A and B. Clearly indicate that the pathway to A has a lower Ea and a lower final energy compared to the pathway to B.

비슷한 문제에 대한 검증된 영상 답변:

이 영상 해법은 위 문제에 도움이 된다고 튜터들이 추천한 것입니다.
영상 길이:
5m

주요 개념

질문에 올바르게 답하기 위해 반드시 이해해야 하는 핵심 개념들은 다음과 같습니다.

Reaction Coordinate Diagram

A reaction coordinate diagram is a graphical representation that illustrates the energy changes during a chemical reaction. It plots the potential energy of the reactants and products against the progress of the reaction. The diagram typically shows the transition states and intermediates, helping to visualize the energy barriers that must be overcome for the reaction to proceed.
추천 영상:
05:02
Coordination Complexes

Stability of Compounds

The stability of a compound refers to its tendency to remain in its current state without undergoing change. In organic chemistry, stability can be influenced by factors such as molecular structure, resonance, sterics, and electronic effects. A more stable compound, like A in this case, has lower energy and is less likely to react compared to a less stable compound, like B.
추천 영상:
05:58
Determining Carbocation Stability

Activation Energy

Activation energy is the minimum energy required for a reaction to occur. It represents the energy barrier that reactants must overcome to form products. In the context of the reaction between A and B, if A has a lower activation energy compared to B, it will form more quickly, as fewer energy inputs are needed to initiate the reaction leading to A.
추천 영상:
08:30
Introduction to free energy diagrams.