Ch. R - Algebra Review
Lial - Trigonometry 12th Edition
Lial12th EditionTrigonometryISBN: 9780136552161Not the one you use?Change textbook
Chapter 1, Problem 69

Use the graph of y = ƒ(x) to find each function value: (a) ƒ(-2) (b) ƒ(0) (c) ƒ(1) and (d) ƒ(4). See Example 7(d).

Verified step by step guidance
1
Identify the function ƒ(x) from the given graph. This means understanding how the graph represents the relationship between x and y, where y = ƒ(x).
For each value of x given (i.e., -2, 0, 1, and 4), locate the corresponding point on the x-axis of the graph.
From each x-value, move vertically to the point on the graph that corresponds to that x. The y-coordinate of this point is the value of ƒ(x) at that x.
Write down the y-coordinate for each x-value: ƒ(-2), ƒ(0), ƒ(1), and ƒ(4). These are the function values you are asked to find.
Double-check each point on the graph to ensure accuracy, especially if the graph has curves or sharp turns, to correctly read the y-values.

Verified video answer for a similar problem:

This video solution was recommended by our tutors as helpful for the problem above.
Video duration:
2m

Key Concepts

Here are the essential concepts you must grasp in order to answer the question correctly.

Understanding Function Notation

Function notation, written as ƒ(x), represents the output value of a function ƒ for a given input x. Evaluating ƒ(a) means finding the y-value on the graph corresponding to the x-value a. This concept is essential for interpreting and extracting values from the graph.
Recommended video:
06:01
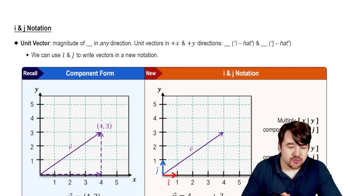
i & j Notation

Reading Graphs of Functions

Reading a graph involves locating specific x-values on the horizontal axis and identifying the corresponding y-values on the vertical axis. This skill allows you to determine function values visually without algebraic expressions, which is crucial for answering questions based on graphs.
Recommended video:
5:53
Graph of Sine and Cosine Function

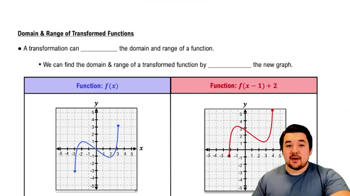
Domain and Range of a Function

The domain is the set of all possible input values (x-values) for which the function is defined, while the range is the set of all possible output values (y-values). Understanding domain ensures you only evaluate ƒ(x) at valid points on the graph.
Recommended video:
4:22
Domain and Range of Function Transformations