Textbook Question
Let and . Find each of the following.
1348
views

 Verified step by step guidance
 5:34 5:34
 5:25
5:25Let and . Find each of the following.
The graph of a function ƒ is shown in the figure. Sketch the graph of each function defined as follows.
(a) y = ƒ(x) +3
The graph of a function ƒ is shown in the figure. Sketch the graph of each function defined as follows.
(b) y = ƒ(x-2)
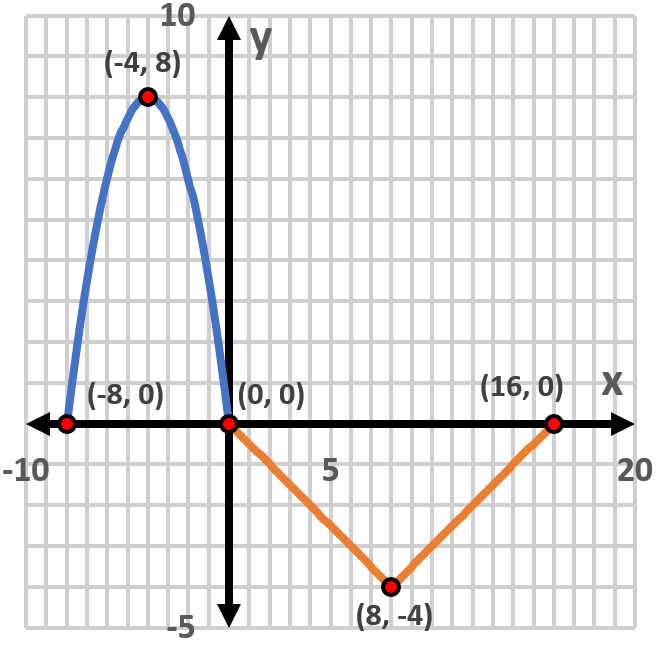
For each function graphed, give the minimum and maximum values of ƒ(x) and the x-values at which they occur.
The graph of a function ƒ is shown in the figure. Sketch the graph of each function defined as follows.
(d) y = |ƒ(x)|
Work each problem. Find a function g(x)=ax+b whose graph can be obtained by translating the graph of ƒ(x)=2x+5 up 2 units and to the left 3 units.