Ch. 2 - Graphs and Functions
Lial - College Algebra 13th Edition
Lial13th EditionCollege AlgebraISBN: 9780136881063Not the one you use?Change textbook
Chapter 3, Problem 21

For each graph, determine whether y is a function of x. Give the domain and range of each relation.
Graph showing two parabolas, one opening upward above y=0 and one opening downward below y=0, on an xy-plane.

Verified step by step guidance
1
Step 1: Identify if y is a function of x by using the vertical line test. A relation is a function if and only if no vertical line intersects the graph at more than one point.
Step 2: Observe the graph. Notice that for some values of x, there are two corresponding y-values (for example, at x = 0, y = 11 and y = -11). This means the vertical line at x = 0 intersects the graph at two points.
Step 3: Since the vertical line at x = 0 intersects the graph at two points, y is not a function of x for this relation.
Step 4: Determine the domain by looking at the x-values covered by the graph. The graph extends horizontally from about -20 to 20, so the domain is approximately \([-20, 20]\).
Step 5: Determine the range by looking at the y-values covered by the graph. The graph extends vertically from about -20 to 20, so the range is approximately \([-20, 20]\).

Verified video answer for a similar problem:

This video solution was recommended by our tutors as helpful for the problem above.
Video duration:
2m
Was this helpful?

Key Concepts

Here are the essential concepts you must grasp in order to answer the question correctly.

Definition of a Function

A function is a relation where each input (x-value) corresponds to exactly one output (y-value). This means no vertical line intersects the graph at more than one point. Understanding this helps determine if y is a function of x by checking if any x-value maps to multiple y-values.
Recommended video:
5:57
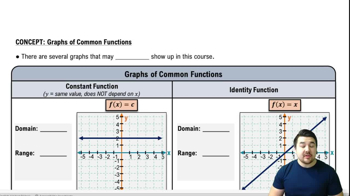
Graphs of Common Functions

Domain and Range

The domain of a relation is the set of all possible x-values, while the range is the set of all possible y-values. Identifying these sets from a graph involves looking at the horizontal spread for the domain and the vertical spread for the range.
Recommended video:
4:22
Domain & Range of Transformed Functions

Vertical Line Test

The vertical line test is a visual method to determine if a graph represents a function. If any vertical line drawn through the graph intersects it more than once, the graph does not represent a function. This test is essential for analyzing the given parabolic curves.
Recommended video:
Guided course
06:49
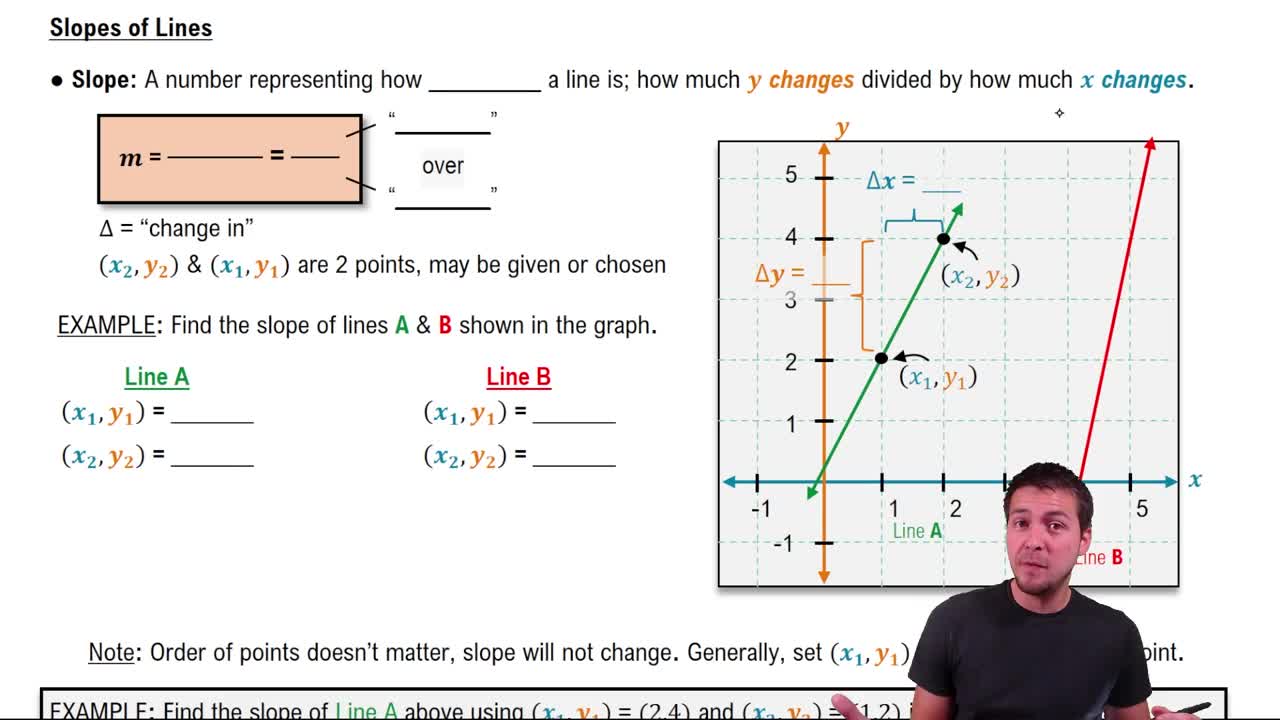
The Slope of a Line