Graph each function by making a table of coordinates. If applicable, use a graphing utility to confirm your hand-drawn graph. f(x) = (0.6)x
Ch. 4 - Exponential and Logarithmic Functions

Chapter 5, Problem 15
Graph each function by making a table of coordinates. If applicable, use a graphing utility to confirm your hand-drawn graph. h(x) = (1/2)x
Verified step by step guidance1
Identify the function given: \(h(x) = \left(\frac{1}{2}\right)^x\). This is an exponential function with base \(\frac{1}{2}\), which means it is a decay function because the base is between 0 and 1.
Create a table of values by choosing several values for \(x\), including negative, zero, and positive integers. For example, select \(x = -2, -1, 0, 1, 2\).
Calculate the corresponding \(h(x)\) values for each chosen \(x\) by substituting into the function: \(h(x) = \left(\frac{1}{2}\right)^x\). Remember that negative exponents mean taking the reciprocal, so \(\left(\frac{1}{2}\right)^{-x} = 2^x\).
Plot the points \((x, h(x))\) from your table on a coordinate plane. This will help you visualize the shape of the graph.
Draw a smooth curve through the plotted points, noting that the graph approaches the \(x\)-axis but never touches it (the \(x\)-axis is a horizontal asymptote). Optionally, use a graphing utility to confirm the accuracy of your hand-drawn graph.

Verified video answer for a similar problem:
This video solution was recommended by our tutors as helpful for the problem above.
Video duration:
2mWas this helpful?
Key Concepts
Here are the essential concepts you must grasp in order to answer the question correctly.
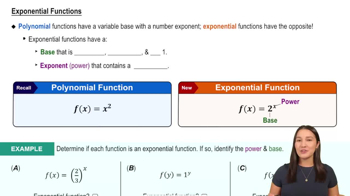
Exponential Functions
An exponential function has the form f(x) = a^x, where the base a is a positive constant. In this question, h(x) = (1/2)^x is an exponential decay function because the base is between 0 and 1. Understanding how the function behaves as x increases or decreases is essential for graphing.
Recommended video:
Exponential Functions
Creating a Table of Coordinates
To graph a function by hand, select various x-values and compute the corresponding y-values to form coordinate pairs. This table helps visualize key points on the graph, showing how the function changes and providing a foundation for sketching the curve accurately.
Recommended video:
Guided course
Graphs and Coordinates - Example
Using Graphing Utilities
Graphing utilities, such as calculators or software, allow you to plot functions quickly and verify hand-drawn graphs. They help confirm the shape, intercepts, and behavior of the function, ensuring accuracy and reinforcing understanding of the function's properties.
Recommended video:
Graphing Rational Functions Using Transformations
Related Practice
Textbook Question
944
views
Textbook Question
Use properties of logarithms to expand each logarithmic expression as much as possible. Where possible, evaluate logarithmic expressions without using a calculator. logb x3
842
views
Textbook Question
Write each equation in its equivalent exponential form. log3 81 = y
966
views
Textbook Question
Use properties of logarithms to expand each logarithmic expression as much as possible. Where possible, evaluate logarithmic expressions without using a calculator. log N-6
893
views
Textbook Question
Solve each exponential equation in Exercises 1–22 by expressing each side as a power of the same base and then equating exponents. 4x=1/√2
776
views
Textbook Question
Solve each exponential equation in Exercises 1–22 by expressing each side as a power of the same base and then equating exponents. 6(x−3)/4=√6
622
views