Solve each polynomial equation in Exercises 1–10 by factoring and then using the zero-product principle.
Ch. 1 - Equations and Inequalities

Chapter 2, Problem 7
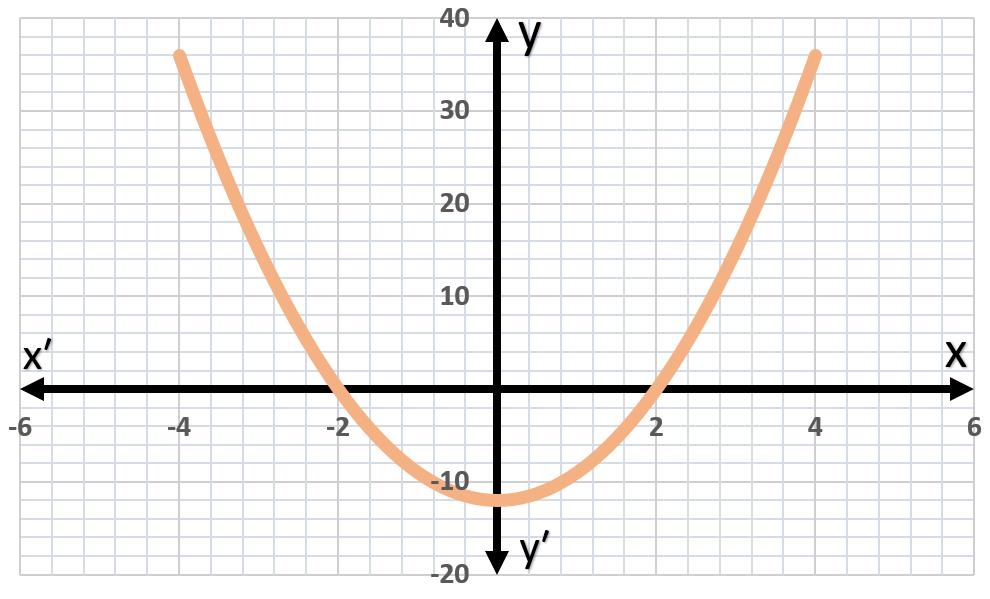
In Exercises 6–8, use the graph and determine the x-intercepts if any, and the y-intercepts if any. For each graph, tick marks along the axes represent one unit each.

Verified step by step guidance1
Observe the graph of the quadratic function provided. The x-axis and y-axis are labeled, and tick marks represent one unit each.
To find the x-intercepts, look for the points where the graph crosses the x-axis. These are the points where the y-value is 0.
From the graph, identify the x-coordinates of the points where the curve intersects the x-axis. These are the x-intercepts.
To find the y-intercept, look for the point where the graph crosses the y-axis. This is the point where the x-value is 0.
From the graph, identify the y-coordinate of the point where the curve intersects the y-axis. This is the y-intercept.

Verified video answer for a similar problem:
This video solution was recommended by our tutors as helpful for the problem above.
Video duration:
1mWas this helpful?
Key Concepts
Here are the essential concepts you must grasp in order to answer the question correctly.
X-Intercepts
X-intercepts are the points where a graph crosses the x-axis. At these points, the value of y is zero. To find the x-intercepts of a function, one typically sets the function equal to zero and solves for x. In the context of a quadratic function, this can involve factoring, using the quadratic formula, or completing the square.
Recommended video:
Guided course
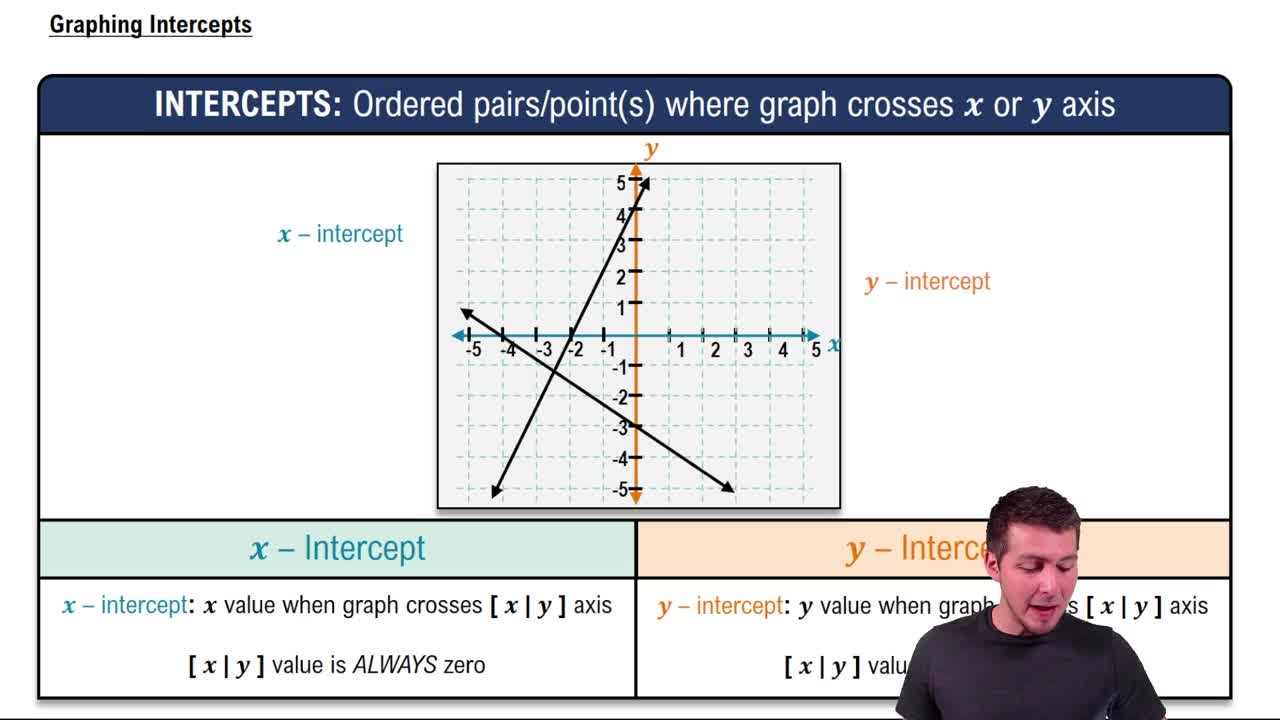
Graphing Intercepts
Y-Intercepts
Y-intercepts are the points where a graph crosses the y-axis, which occurs when the value of x is zero. To determine the y-intercept of a function, one evaluates the function at x = 0. For quadratic functions, this is simply the constant term when the function is expressed in standard form.
Recommended video:
Guided course
Graphing Intercepts
Quadratic Functions
Quadratic functions are polynomial functions of degree two, typically expressed in the form f(x) = ax² + bx + c, where a, b, and c are constants. The graph of a quadratic function is a parabola, which can open upwards or downwards depending on the sign of the coefficient 'a'. Understanding the shape and properties of parabolas is essential for analyzing their intercepts.
Recommended video:
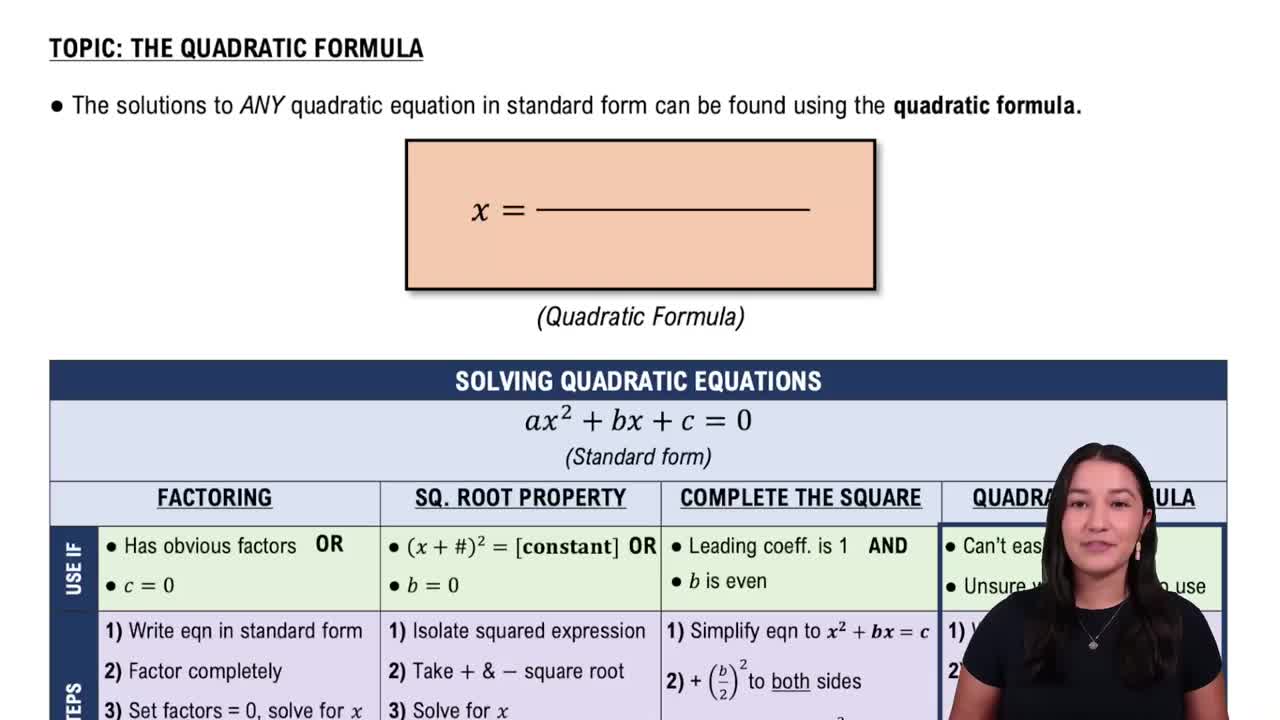
Solving Quadratic Equations Using The Quadratic Formula
Related Practice
Textbook Question
539
views
Textbook Question
A new car worth \$36,000 is depreciating in value by \$4000 per year. a. Write a formula that models the car's value, y, in dollars, after x years. b. Use the formula from part (a) to determine after how many years the car's value will be \$12,000. c. Graph the formula from part (a) in the first quadrant of a rectangular coordinate system. Then show your solution to part (b) on the graph.
603
views
Textbook Question
In Exercises 1–14, express each interval in set-builder notation and graph the interval on a number line. (2, ∞)
1049
views
Textbook Question
Solve each equation in Exercises 1 - 14 by factoring.
959
views
Textbook Question
Plot the given point in a rectangular coordinate system. (- 4, - 2)
123
views
Textbook Question
In Exercises 1–8, add or subtract as indicated and write the result in standard form. 8i - (14 - 9i)
807
views