Solve and check each linear equation. 3(x - 1) = 21
Ch. 1 - Equations and Inequalities

Chapter 2, Problem 6
In Exercises 6–8, use the graph and determine the x-intercepts if any, and the y-intercepts if any. For each graph, tick marks along the axes represent one unit each.

Verified step by step guidance1
Observe the graph and identify the points where the line crosses the x-axis and y-axis. These are the x-intercept and y-intercept, respectively.
To find the x-intercept, locate the point where the line crosses the x-axis. At this point, the y-coordinate is 0. From the graph, the x-intercept appears to be at x = -2.
To find the y-intercept, locate the point where the line crosses the y-axis. At this point, the x-coordinate is 0. From the graph, the y-intercept appears to be at y = 7.
Verify the intercepts by checking the coordinates of the points visually on the graph. The x-intercept is (-2, 0), and the y-intercept is (0, 7).
Summarize the intercepts: The x-intercept is at (-2, 0), and the y-intercept is at (0, 7). These points represent where the line crosses the respective axes.

Verified video answer for a similar problem:
This video solution was recommended by our tutors as helpful for the problem above.
Video duration:
1mWas this helpful?
Key Concepts
Here are the essential concepts you must grasp in order to answer the question correctly.
X-Intercept
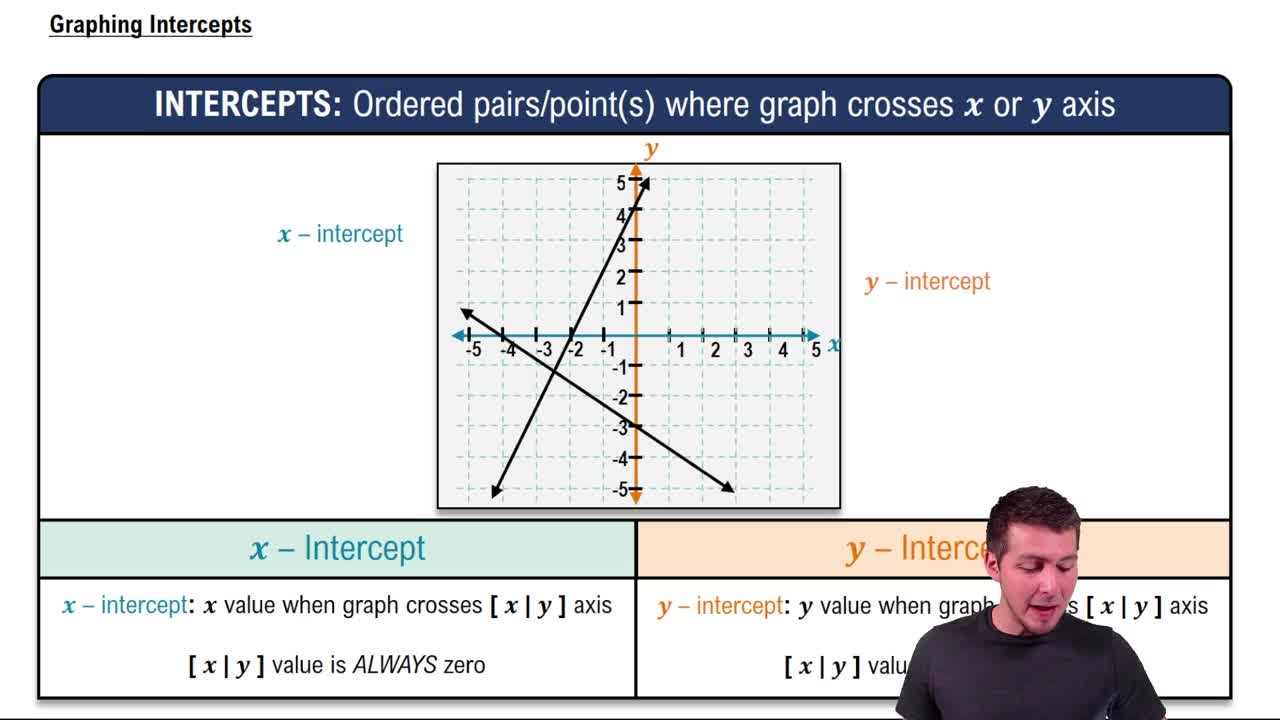
The x-intercept of a graph is the point where the graph crosses the x-axis. At this point, the value of y is zero. To find the x-intercept, you can set the equation of the line to zero and solve for x. In the context of the provided graph, identifying the x-intercept involves locating the point where the orange line intersects the x-axis.
Recommended video:
Guided course
Graphing Intercepts
Y-Intercept
The y-intercept of a graph is the point where the graph crosses the y-axis, where the value of x is zero. To determine the y-intercept, you set the equation of the line to zero and solve for y. In the given graph, the y-intercept can be found by observing where the orange line intersects the y-axis.
Recommended video:
Guided course
Graphing Intercepts
Graph Interpretation
Graph interpretation involves analyzing the visual representation of mathematical functions to extract information such as intercepts, slopes, and trends. Understanding how to read a graph is crucial for solving problems related to linear equations, as it allows you to identify key features like intercepts and the overall behavior of the function represented by the graph.
Recommended video:
Guided course
Graphs and Coordinates - Example
Related Practice
Textbook Question
1006
views
Textbook Question
A new car worth \$36,000 is depreciating in value by \$4000 per year. a. Write a formula that models the car's value, y, in dollars, after x years. b. Use the formula from part (a) to determine after how many years the car's value will be \$12,000. c. Graph the formula from part (a) in the first quadrant of a rectangular coordinate system. Then show your solution to part (b) on the graph.
603
views
Textbook Question
In Exercises 1–14, express each interval in set-builder notation and graph the interval on a number line. (2, ∞)
1049
views
Textbook Question
Solve each equation in Exercises 1 - 14 by factoring.
1052
views
Textbook Question
In Exercises 1–14, express each interval in set-builder notation and graph the interval on a number line. [- 3, 1]
764
views
Textbook Question
Plot the given point in a rectangular coordinate system. (- 4, - 2)
123
views