

 15:24
15:24

Textbook Question
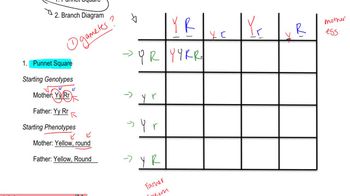
In a diploid plant species, an F₁ with the genotype Gg Ll Tt is test-crossed to a pure-breeding recessive plant with the genotype gg ll tt. The offspring genotypes are as follows:
Why is the recombination frequency for the outside pair of genes not equal to the sum of recombination frequencies between the adjacent gene pairs?
738
views