A survey of organisms living deep in the ocean reveals two new species whose DNA is isolated for analysis. DNA samples from both species are treated to remove nonhistone proteins. Each DNA sample is then treated with DNase I that cuts DNA not protected by histone proteins but is unable to cut DNA bound by histone proteins. Following DNase I treatment, DNA samples are subjected to gel electrophoresis, and the gels are stained to visualize all DNA bands in the gel. The staining patterns of DNA bands from each species are shown in the figure. The number of base pairs in small DNA fragments is shown at the left of the gel. Interpret the gel results in terms of chromatin organization and the spacing of nucleosomes in the chromatin of each species.

- Ch. 1 - The Molecular Basis of Heredity, Variation, and Evolution64
- Ch. 2 - Transmission Genetics144
- Ch. 3 - Cell Division and Chromosome Heredity81
- Ch. 4 - Gene Interaction87
- Ch. 5 - Genetic Linkage and Mapping in Eukaryotes103
- Ch. 6 - Genetic Analysis and Mapping in Bacteria and Bacteriophages73
- Ch. 7 - DNA Structure and Replication71
- Ch. 8 - Molecular Biology of Transcription and RNA Processing79
- Ch. 9 - The Molecular Biology of Translation110
- Ch. 10 - Eukaryotic Chromosome Abnormalities and Molecular Organization100
- Ch. 11 - Gene Mutation, DNA Repair, and Homologous Recombination86
- Ch. 12 - Regulation of Gene Expression in Bacteria and Bacteriophage90
- Ch. 13 - Regulation of Gene Expression in Eukaryotes38
- Ch. 14 - Analysis of Gene Function via Forward Genetics and Reverse Genetics72
- Ch. 15 - Recombinant DNA Technology and Its Applications69
- Ch. 16 - Genomics: Genetics from a Whole-Genome Perspective49
- Ch. 17 - Organelle Inheritance and the Evolution of Organelle Genomes27
- Ch. 18 - Developmental Genetics43
- Ch. 19 - Genetic Analysis of Quantitative Traits66
- Ch. 20 - Population Genetics and Evolution at the Population, Species, and Molecular Levels105
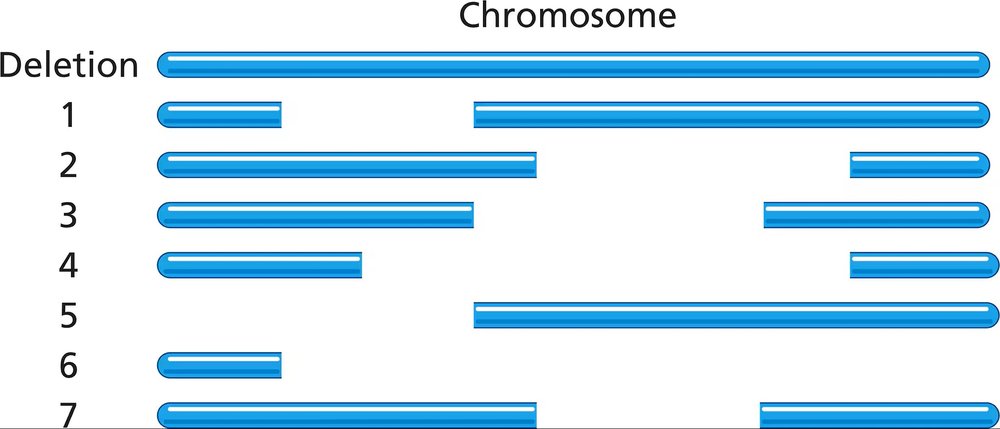
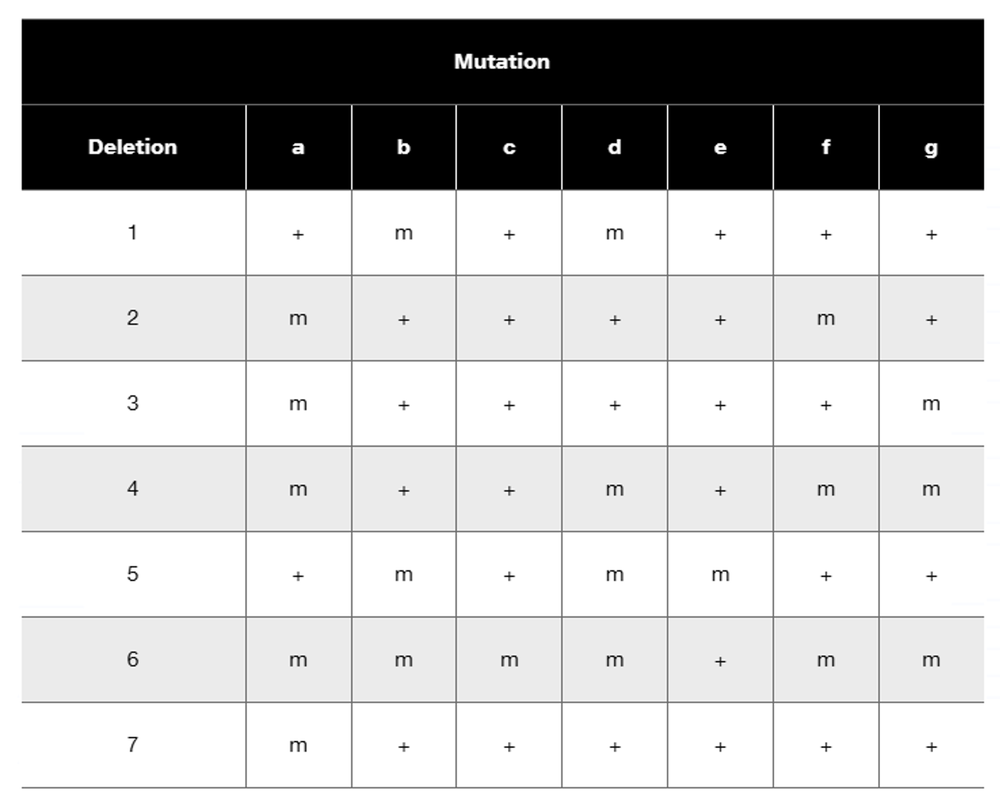
In Drosophila, seven partial deletions (1 to 7) shown as gaps in the following diagram have been mapped on a chromosome. This region of the chromosome contains genes that express seven recessive mutant phenotypes, identified in the following table as a through g. A researcher wants to determine the location and order of genes on the chromosome, so he sets up a series of crosses in which flies homozygous for a mutant allele are crossed with flies homozygous for a partial deletion. The progeny are scored to determine whether they have the mutant phenotype ('m' in the table) or the wild-type phenotype ('+' in the table). Use the partial deletion map and the table of progeny phenotypes to determine the order of genes on the chromosome.
 Verified step by step guidance
Verified video answer for a similar problem:
Key Concepts
Chromosomal Mapping

 07:11
07:11Recessive Mutant Phenotypes
 10:48
10:48Genetic Crosses
 26:08
26:08In humans that are XX/XO mosaics, the phenotype is highly variable, ranging from females who have classic Turner syndrome symptoms to females who are essentially normal. Likewise, XY/XO mosaics have phenotypes that range from Turner syndrome females to essentially normal males. How can the wide range of phenotypes be explained for these sex-chromosome mosaics?
A plant breeder would like to develop a seedless variety of cucumber from two existing lines. Line A is a tetraploid line, and line B is a diploid line. Describe the breeding strategy that will produce a seedless line, and support your strategy by describing the results of crosses.
Two experimental varieties of strawberry are produced by crossing a hexaploid line that contains 48 chromosomes and a tetraploid line that contains 32 chromosomes. Experimental variety 1 contains 40 chromosomes, and experimental variety 2 contains 56 chromosomes.
Do you expect both experimental lines to be fertile? Why or why not?
Two experimental varieties of strawberry are produced by crossing a hexaploid line that contains 48 chromosomes and a tetraploid line that contains 32 chromosomes. Experimental variety 1 contains 40 chromosomes, and experimental variety 2 contains 56 chromosomes.
How many chromosomes from the hexaploid line are contributed to experimental variety 1? To experimental variety 2?
Two experimental varieties of strawberry are produced by crossing a hexaploid line that contains 48 chromosomes and a tetraploid line that contains 32 chromosomes. Experimental variety 1 contains 40 chromosomes, and experimental variety 2 contains 56 chromosomes.
How many chromosomes from the tetraploid lines are contributed to experimental variety 1? To experimental variety 2?