

 04:06
04:06
Textbook Question
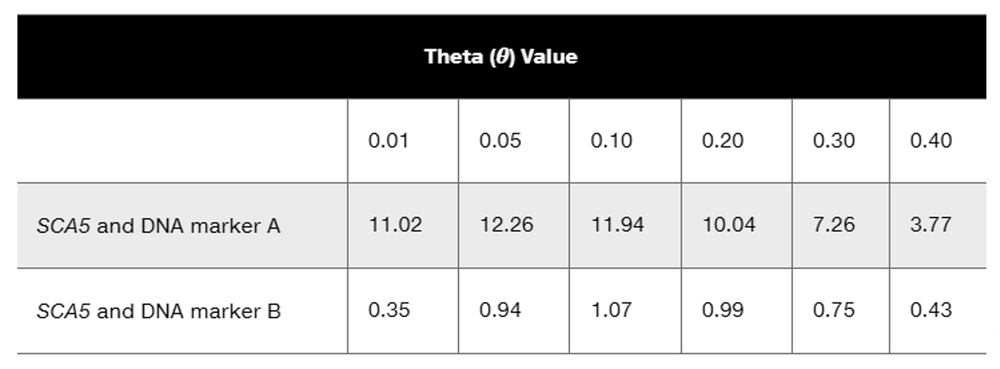
Neurofibromatosis 1 (NF1) is an autosomal dominant disorder inherited on human chromosome 17. Part of the analysis mapping the NF1 gene to chromosome 17 came from genetic linkage studies testing segregation of NF1 and DNA genetic markers on various chromosomes. A DNA marker with two alleles, designated 1 and 2, is linked to NF1. The pedigree below shows segregation of NF1 (darkened symbols) and gives genotypes for the DNA marker for each family member.
Determine the alleles for the NF1 gene and the DNA marker gene on each chromosome carried by the four family members in generation I and generation II. Use N for the dominant NF1 allele and n for the recessive allele and assume I-1 is heterozygous for the disease allele (Nn).
924
views