


 02:48
02:48
Textbook Question
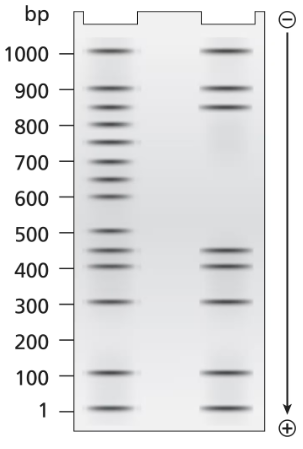
A 3.5-kb segment of DNA containing the complete sequence of a mouse gene is available. The DNA segment contains the promoter sequence and extends beyond the polyadenylation site of the gene. The DNA is studied by band shift assay, and the following gel bands are observed.
Match these conditions to a specific lane of the gel.
3.5-kb fragment plus RNA polymerase II
354
views