Ch. R - Algebra Review
Lial - Trigonometry 12th Edition
Lial12th EditionTrigonometryISBN: 9780136552161Not the one you use?Change textbook
Chapter 1, Problem 67

Graph each function. See Examples 6–8. h(x) = -(x + 1)³

Verified step by step guidance
1
Recognize that the function given is a cubic function of the form \(h(x) = -(x + 1)^3\), which is a transformation of the basic cubic function \(f(x) = x^3\).
Identify the transformations applied to the basic cubic function: the \((x + 1)\) inside the cube indicates a horizontal shift to the left by 1 unit, and the negative sign outside the cube indicates a reflection across the x-axis.
Start by plotting the basic cubic function \(f(x) = x^3\), which passes through points like \((0,0)\), \((1,1)\), and \((-1,-1)\).
Apply the horizontal shift by replacing \(x\) with \((x + 1)\), so the key points shift left by 1 unit: for example, \((0,0)\) becomes \((-1,0)\), \((1,1)\) becomes \((0,1)\), and \((-1,-1)\) becomes \((-2,-1)\).
Finally, apply the reflection by multiplying the output values by \(-1\), flipping the graph over the x-axis. For example, the point \((-1,0)\) remains \((-1,0)\), \((0,1)\) becomes \((0,-1)\), and \((-2,-1)\) becomes \((-2,1)\). Plot these points and sketch the smooth cubic curve through them.

Verified video answer for a similar problem:

This video solution was recommended by our tutors as helpful for the problem above.
Video duration:
7m
Was this helpful?

Key Concepts

Here are the essential concepts you must grasp in order to answer the question correctly.

Graphing Cubic Functions

Cubic functions have the general form f(x) = ax³ + bx² + cx + d and produce characteristic S-shaped curves. Understanding their end behavior and inflection points helps in sketching their graphs accurately. The function h(x) = -(x + 1)³ is a cubic shifted left by 1 unit and reflected over the x-axis.
Recommended video:
5:53
Graph of Sine and Cosine Function

Transformations of Functions

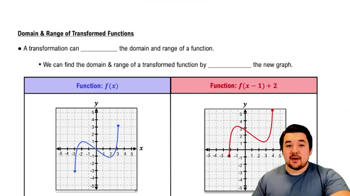
Function transformations include shifts, reflections, stretches, and compressions. For h(x) = -(x + 1)³, the '+1' inside the parentheses shifts the graph left by 1 unit, and the negative sign outside reflects it across the x-axis. Recognizing these changes helps in modifying the parent graph accordingly.
Recommended video:
4:22
Domain and Range of Function Transformations

Plotting Key Points and Symmetry

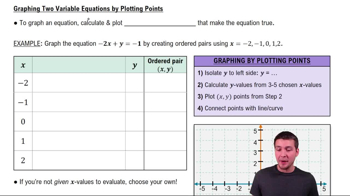
Plotting key points such as the inflection point and intercepts provides a framework for graphing. Cubic functions are symmetric about their inflection point, which for h(x) = -(x + 1)³ is at (-1, 0). Using these points ensures an accurate sketch of the curve.
Recommended video:
4:29
Graphing Two Variable Equations by Plotting Points