Use the vertical line test to identify graphs in which y is a function of x.
Ch. 2 - Functions and Graphs

Chapter 3, Problem 12
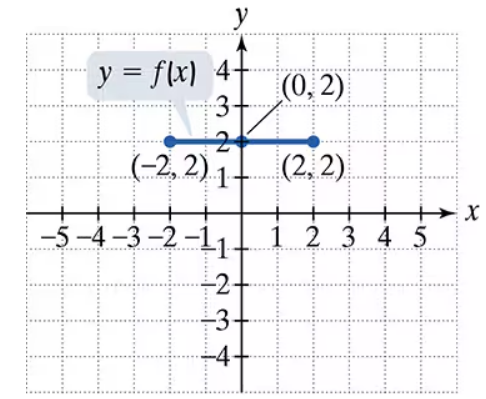
Use the graph of y = f(x) to graph each function g.

g(x) = 2f(x)
Verified step by step guidance1
Step 1: Observe the graph of y = f(x). It is a horizontal line segment from (1, -3) to (4, -3), meaning the function f(x) is constant and equal to -3 for all x in the interval [1, 4].
Step 2: Understand the transformation g(x) = 2f(x). This means that the values of f(x) are multiplied by 2 to produce g(x). Mathematically, g(x) = 2 * (-3) = -6 for all x in the interval [1, 4].
Step 3: Determine the new graph of g(x). Since g(x) is constant and equal to -6, the graph of g(x) will also be a horizontal line segment, but at y = -6 instead of y = -3.
Step 4: Plot the new line segment for g(x). The endpoints of the line segment will remain the same in terms of x-coordinates, so the new line segment will extend from (1, -6) to (4, -6).
Step 5: Label the graph appropriately. Indicate that the new graph represents g(x) = 2f(x), and ensure the horizontal line segment is clearly drawn at y = -6 between x = 1 and x = 4.

Verified video answer for a similar problem:
This video solution was recommended by our tutors as helpful for the problem above.
Video duration:
1mWas this helpful?
Key Concepts
Here are the essential concepts you must grasp in order to answer the question correctly.
Function Transformation
Function transformation refers to the process of altering the graph of a function through various operations, such as vertical or horizontal shifts, stretches, or reflections. In this case, the function g(x) = 2f(x) represents a vertical stretch of the original function f(x) by a factor of 2, which means that every output value of f(x) is multiplied by 2.
Recommended video:
Domain & Range of Transformed Functions
Graphing Functions
Graphing functions involves plotting points on a coordinate plane based on the function's input-output relationship. For the function g(x) = 2f(x), the graph can be derived from the graph of f(x) by taking each y-coordinate of f(x) and multiplying it by 2, effectively doubling the height of the graph while keeping the x-coordinates the same.
Recommended video:
Graphs of Logarithmic Functions
Horizontal and Vertical Lines
Horizontal lines in a graph represent constant functions where the output value remains the same regardless of the input. In the provided graph, f(x) is a horizontal line at y = -3 between x = 1 and x = 4. When transforming this line to g(x) = 2f(x), the new line will be at y = -6, maintaining its horizontal nature but at a different vertical position.
Recommended video:
Guided course
The Slope of a Line
Related Practice
Textbook Question
190
views
Textbook Question
Use the graph of y = f(x) to graph each function g.
g(x) = ½ f(x)
1721
views
Textbook Question
Find the domain of each function. f(x) = 1/(x2+1) - 1/(x2-1)
969
views
Textbook Question
Use the given conditions to write an equation for each line in point-slope form and general form. Passing through (5, −9) and perpendicular to the line whose equation is x + 7y - 12= 0
170
views
Textbook Question
Find the distance between each pair of points. If necessary, express answers in simplified radical form and then round to two decimal places. (3.5, 8.2) and (-0.5, 6.2)
831
views
Textbook Question
The functions in Exercises 11-28 are all one-to-one. For each function, a. Find an equation for f-1(x), the inverse function. b. Verify that your equation is correct by showing that f(ƒ-1 (x)) = = x and ƒ-1 (f(x)) = x. f(x) = 2x
614
views