Ch. 2 - Functions and Graphs
Blitzer - College Algebra 8th Edition
Blitzer8th EditionCollege AlgebraISBN: 9780136970514Not the one you use?Change textbook
Chapter 3, Problem 41

Graph the given functions, f and g, in the same rectangular coordinate system. Select integers for x, starting with -2 and ending with 2. Once you have obtained your graphs, describe how the graph of g is related to the graph of f. f(x) = -2x, g(x) = -2x-1

Verified step by step guidance
1
Identify the given functions: \(f(x) = -2x\) and \(g(x) = -2x - 1\). Notice that both are linear functions with the same slope but different y-intercepts.
Create a table of values for \(x\) starting from \(-2\) to \(2\) for both functions. For each \(x\), calculate \(f(x)\) using \(f(x) = -2x\) and \(g(x)\) using \(g(x) = -2x - 1\).
Plot the points for \(f(x)\) on the coordinate plane by marking the pairs \((x, f(x))\) for \(x = -2, -1, 0, 1, 2\). Connect these points to form the graph of \(f\).
Similarly, plot the points for \(g(x)\) by marking the pairs \((x, g(x))\) for the same \(x\) values and connect these points to form the graph of \(g\).
Compare the two graphs: since \(g(x)\) differs from \(f(x)\) by a constant \(-1\), the graph of \(g\) is a vertical shift of the graph of \(f\) downward by 1 unit.

Verified video answer for a similar problem:

This video solution was recommended by our tutors as helpful for the problem above.
Video duration:
2m
Was this helpful?

Key Concepts

Here are the essential concepts you must grasp in order to answer the question correctly.

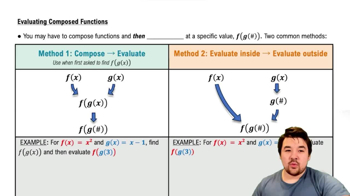
Function Notation and Evaluation

Function notation, such as f(x) and g(x), represents a rule that assigns each input x to an output value. Evaluating a function involves substituting specific x-values into the function's formula to find corresponding y-values, which are essential for plotting points on a graph.
Recommended video:
4:26
Evaluating Composed Functions

Graphing Linear Functions

Linear functions produce straight-line graphs characterized by a constant rate of change or slope. Plotting points for selected x-values and connecting them helps visualize the function, revealing properties like slope and y-intercept that define the line's position and direction.
Recommended video:
5:26
Graphs of Logarithmic Functions

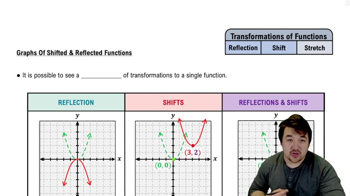
Transformations of Graphs (Vertical Shifts)

A vertical shift moves a graph up or down without changing its shape. In the given functions, g(x) = f(x) - 1 represents a downward shift of the graph of f(x) by 1 unit, meaning every point on f's graph is moved one unit lower to obtain g's graph.
Recommended video:
4:25
Graphs of Shifted & Reflected Functions