

 04:37
04:37
Textbook Question
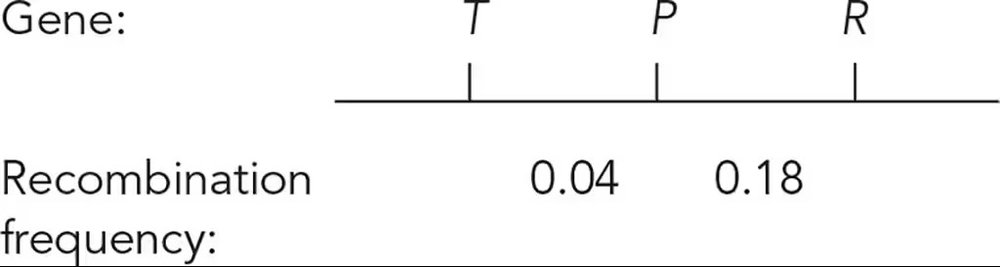
In tomatoes, the allele T for tall plant height is dominant to dwarf allele t, the P allele for smooth skin is dominant to the p allele for peach fuzz skin, and the allele R for round fruit is dominant to the recessive r allele for oblong fruit. The genes controlling these traits are linked on chromosome 1 in the tomato genome, and the genes are arranged in the order and with the recombination frequencies shown.
A pure-breeding tall, peach fuzz, round plant is crossed to a pure-breeding plant that is dwarf, smooth, oblong. What are the gamete genotypes produced by each of these plants?
815
views