Ch. R - Algebra Review
Lial - Trigonometry 12th Edition
Lial12th EditionTrigonometryISBN: 9780136552161Not the one you use?Change textbook
Chapter 1, Problem 19

Graph each function. See Examples 1 and 2. g(x) = 2x²

Verified step by step guidance
1
Recognize that the function given is a quadratic function of the form \(g(x) = 2x^{2}\), which is a parabola opening upwards because the coefficient of \(x^{2}\) is positive.
Identify the vertex of the parabola. Since the function is in the form \(g(x) = ax^{2} + bx + c\) with \(a=2\), \(b=0\), and \(c=0\), the vertex is at the origin \((0,0)\).
Create a table of values by choosing several \(x\)-values (both positive and negative), then calculate the corresponding \(g(x)\) values using the formula \(g(x) = 2x^{2}\).
Plot the points from the table on the coordinate plane. Because the parabola is symmetric about the y-axis, points with \(x\) and \(-x\) will have the same \(g(x)\) value.
Draw a smooth curve through the plotted points to complete the graph of \(g(x) = 2x^{2}\), ensuring the parabola opens upwards and is narrower than the graph of \(y = x^{2}\) due to the coefficient 2.

Verified video answer for a similar problem:

This video solution was recommended by our tutors as helpful for the problem above.
Video duration:
6m
Was this helpful?

Key Concepts

Here are the essential concepts you must grasp in order to answer the question correctly.

Understanding Quadratic Functions

A quadratic function is a polynomial of degree two, typically written as f(x) = ax² + bx + c. Its graph is a parabola, which opens upward if a > 0 and downward if a < 0. In g(x) = 2x², the coefficient 2 affects the parabola's width and direction.
Recommended video:
6:36
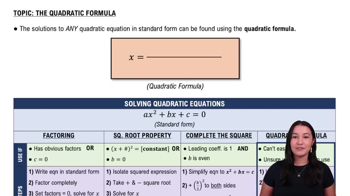
Quadratic Formula

Graphing Parabolas

Graphing a parabola involves plotting points by substituting x-values into the function and finding corresponding y-values. The vertex of g(x) = 2x² is at the origin (0,0), and the parabola is symmetric about the y-axis. Understanding this symmetry helps in sketching the graph accurately.
Recommended video:
4:08
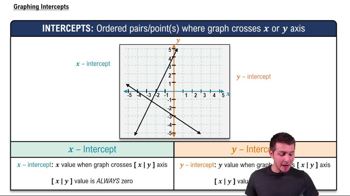
Graphing Intercepts

Effect of the Leading Coefficient on the Graph

The leading coefficient (the number before x²) determines the parabola's width and direction. For g(x) = 2x², the coefficient 2 makes the parabola narrower than the standard x² graph, indicating a steeper curve. Larger coefficients compress the graph vertically, while smaller ones stretch it.
Recommended video:
4:08
Graphing Intercepts