Ch. 2 - Graphs and Functions
Lial - College Algebra 13th Edition
Lial13th EditionCollege AlgebraISBN: 9780136881063Not the one you use?Change textbook
Chapter 3, Problem 40

Graph each equation. 3y = x

Verified step by step guidance
1
Rewrite the given equation \(3y = x\) in slope-intercept form \(y = mx + b\) by isolating \(y\). Divide both sides of the equation by 3 to get \(y = \frac{x}{3}\).
Identify the slope \(m\) and the y-intercept \(b\) from the equation \(y = \frac{1}{3}x + 0\). Here, the slope \(m = \frac{1}{3}\) and the y-intercept \(b = 0\).
Plot the y-intercept on the coordinate plane. Since \(b = 0\), plot the point at the origin \((0,0)\).
Use the slope \(\frac{1}{3}\) to find another point. From the y-intercept, move up 1 unit and right 3 units to plot the second point \((3,1)\).
Draw a straight line through the two points \((0,0)\) and \((3,1)\). This line represents the graph of the equation \(3y = x\).

Verified video answer for a similar problem:

This video solution was recommended by our tutors as helpful for the problem above.
Video duration:
1m
Was this helpful?

Key Concepts

Here are the essential concepts you must grasp in order to answer the question correctly.

Understanding Linear Equations

A linear equation represents a straight line when graphed on the coordinate plane. It typically has the form y = mx + b, where m is the slope and b is the y-intercept. Recognizing that 3y = x can be rewritten into this form helps in graphing the line.
Recommended video:
06:00
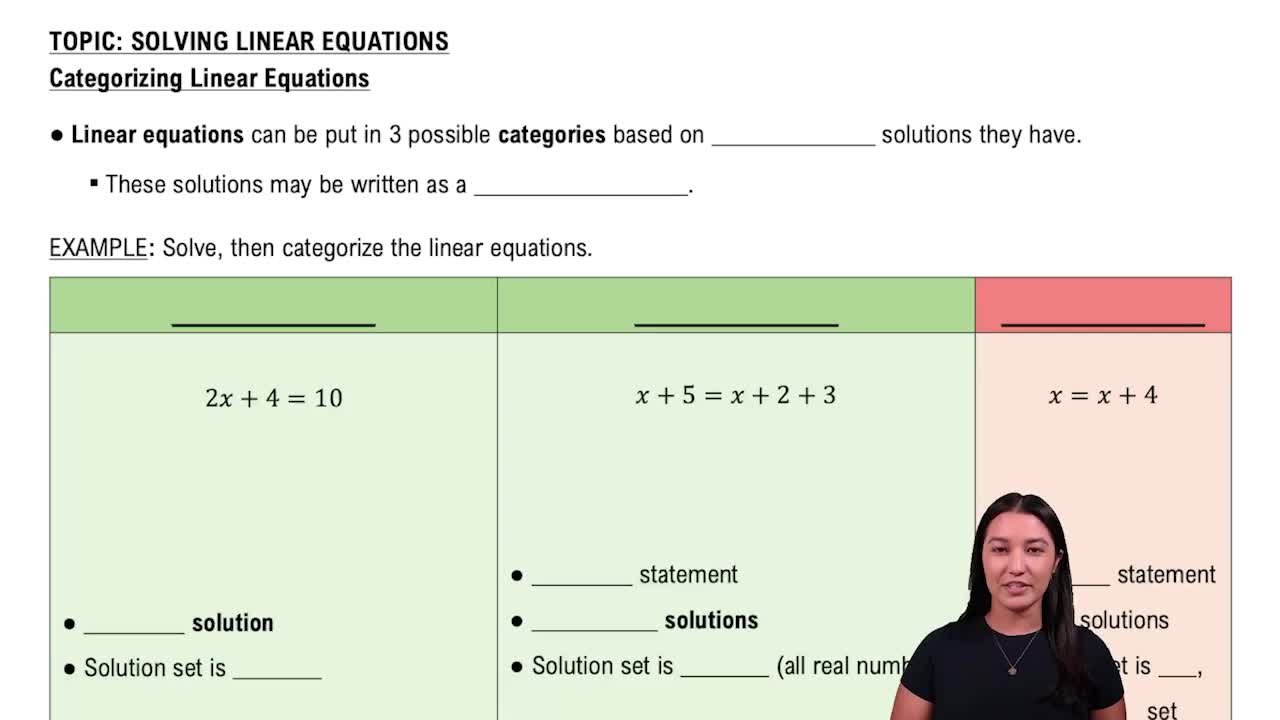
Categorizing Linear Equations

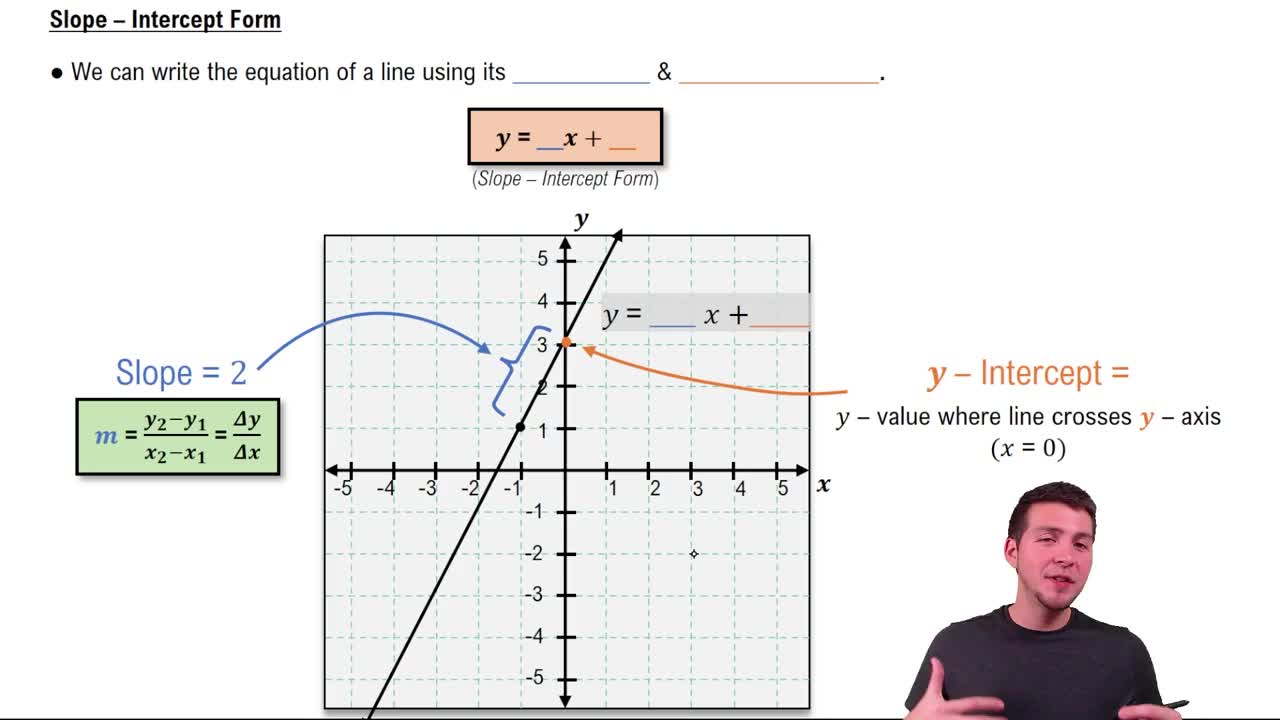
Slope and Intercept

The slope indicates the steepness and direction of a line, calculated as the ratio of vertical change to horizontal change. The y-intercept is the point where the line crosses the y-axis. Identifying these from the equation allows for accurate plotting of the line.
Recommended video:
Guided course
03:56
Slope-Intercept Form

Graphing on the Coordinate Plane

Graphing involves plotting points that satisfy the equation and connecting them to form the line. Understanding how to find points by substituting values for x or y and using the slope and intercept to guide the drawing is essential for visualizing the equation.
Recommended video:
Guided course
02:16
Graphs and Coordinates - Example