Textbook Question
List as many human traits as you can that are likely to be under the control of a polygenic mode of inheritance.
462
views

 Verified step by step guidance
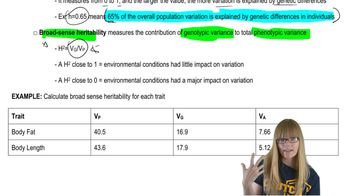
 07:04
07:04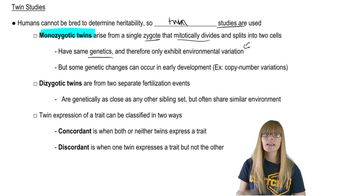 03:59
03:59 13:40
13:40List as many human traits as you can that are likely to be under the control of a polygenic mode of inheritance.
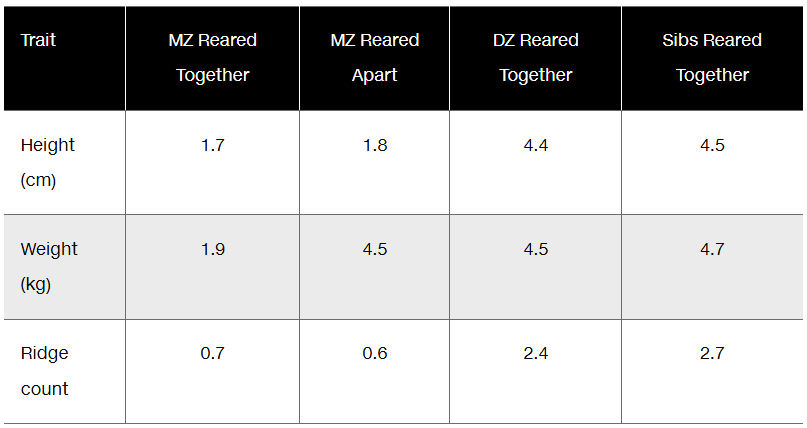
What kind of heritability estimates (broad sense or narrow sense) are obtained from human twin studies?
Erma and Harvey were a compatible barnyard pair, but a curious sight. Harvey's tail was only 6 cm long, while Erma's was 30 cm. Their F₁ piglet offspring all grew tails that were 18 cm. When inbred, an F₂ generation resulted in many piglets (Erma and Harvey's grandpigs), whose tails ranged in 4-cm intervals from 6 to 30 cm (6, 10, 14, 18, 22, 26, and 30). Most had 18-cm tails, while 1/64 had 6-cm tails and 1/64 had 30-cm tails.
If one of the 18-cm-tail F₁ pigs is mated with one of the 6-cm-tail F₂ pigs, what phenotypic ratio will be predicted if many offspring resulted? Diagram the cross.
An inbred strain of plants has a mean height of 24 cm. A second strain of the same species from a different geographic region also has a mean height of 24 cm. When plants from the two strains are crossed together, the F₁ plants are the same height as the parent plants. However, the F₂ generation shows a wide range of heights; the majority are like the P₁ and F₁ plants, but approximately 4 of 1000 are only 12 cm high and about 4 of 1000 are 36 cm high.
Indicate three possible genotypes that could account for F₂ plants that are 18 cm high and three that account for F₂ plants that are 33 cm high.
Corn plants from a test plot are measured, and the distribution of heights at 10-cm intervals is recorded in the following table:
Height (cm) Plants (no.)
100 20
110 60
120 90
130 130
140 180
150 120
160 70
170 50
180 40
Calculate
(a) the mean height,
(b) the variance,
(c) the standard deviation, and
(d) the standard error of the mean.
Plot a rough graph of plant height against frequency. Do the values represent a normal distribution? Based on your calculations, how would you assess the variation within this population?
Erma and Harvey were a compatible barnyard pair, but a curious sight. Harvey's tail was only 6 cm long, while Erma's was 30 cm. Their F₁ piglet offspring all grew tails that were 18 cm. When inbred, an F₂ generation resulted in many piglets (Erma and Harvey's grandpigs), whose tails ranged in 4-cm intervals from 6 to 30 cm (6, 10, 14, 18, 22, 26, and 30). Most had 18-cm tails, while 1/64 had 6-cm tails and 1/64 had 30-cm tails.
Explain how these tail lengths were inherited by describing the mode of inheritance, indicating how many gene pairs were at work, and designating the genotypes of Harvey, Erma, and their 18-cm-tail offspring.