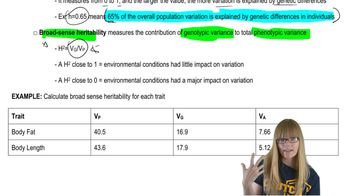
Pearson+ LogoPearson+ Logo
Ch. 19 - Genetic Analysis of Quantitative Traits
Sanders - Genetic Analysis: An Integrated Approach 3rd Edition
Sanders3rd EditionGenetic Analysis: An Integrated ApproachISBN: 9780135564172Not the one you use?Change textbook
Chapter 19, Problem 15

Suppose the length of maize ears has narrow sense heritability (h²) of 0.70. A population produces ears that have an average length of 28 cm, and from this population a breeder selects a plant producing 34-cm ears to cross by self-fertilization. Predict the selection differential (S) and the response to selection (R) for this cross.

Verified step by step guidance
1
Understand the key terms: Narrow sense heritability (h²) is the proportion of phenotypic variance that is due to additive genetic variance. The selection differential (S) is the difference between the mean phenotype of the selected parents and the mean phenotype of the original population. The response to selection (R) is the change in the mean phenotype of the offspring population due to selection, calculated as R = h² × S.
Calculate the selection differential (S): Subtract the mean phenotype of the original population (28 cm) from the phenotype of the selected parent (34 cm). This gives S = 34 - 28.
Recall the formula for the response to selection (R): Use the equation R = h² × S, where h² is the narrow sense heritability (0.70) and S is the selection differential calculated in the previous step.
Substitute the values into the formula: Replace h² with 0.70 and S with the value obtained in step 2. This will give you the predicted response to selection (R).
Interpret the results: The response to selection (R) represents the expected increase in the mean ear length of the offspring population compared to the original population. Add this value to the original population mean (28 cm) to predict the new mean ear length in the offspring population.

Verified video answer for a similar problem:

This video solution was recommended by our tutors as helpful for the problem above.
Video duration:
3m
Was this helpful?

Key Concepts

Here are the essential concepts you must grasp in order to answer the question correctly.

Narrow Sense Heritability (h²)

Narrow sense heritability (h²) quantifies the proportion of phenotypic variance in a trait that is attributable to additive genetic variance. It is crucial for predicting the response to selection, as it indicates how much of the trait's variation can be passed on to the next generation. A higher h² value suggests that selection will be more effective in altering the trait in future generations.
Recommended video:
Guided course
07:04
Calculating Heritability

Selection Differential (S)

The selection differential (S) is the difference between the mean phenotype of the selected individuals and the mean phenotype of the entire population. It measures the intensity of selection and is a key factor in determining how much the average trait value will change in the next generation. A larger S indicates stronger selection pressure, leading to a greater potential change in the trait.
Recommended video:
Guided course
04:15
Artificial Selection

Response to Selection (R)

Response to selection (R) is the expected change in the mean phenotype of a trait in the next generation as a result of selection. It can be calculated using the formula R = h² × S, where h² is the narrow sense heritability and S is the selection differential. Understanding R helps breeders predict how effective their selection strategies will be in achieving desired trait improvements.
Recommended video:
Guided course
04:15
Artificial Selection
Related Practice
Textbook Question

Two inbred lines of sunflowers (P₁ and P₂) produce different total weights of seeds per flower head. The mean weight of seeds (grams) and the variance of seed weights in different generations are as follows:

Use the information above to determine VG, VE, and VP for this trait.


593
views
Textbook Question

What is a quantitative trait locus (QTL)? Suppose you wanted to search for QTLs influencing fruit size in tomatoes. Describe the general structure of a QTL experiment, including the kind of tomato strains you would use, how molecular markers should be distributed in the genome, how the genetic marker alleles should differ between the two strains, and how you would use the F₁ progeny in a subsequent cross to obtain information about the possible location(s) of QTLs of interest.

757
views
Textbook Question

In Nicotiana, two inbred strains produce long (PL) and short (PS) corollas. These lines are crossed to produce F₁, and the F₁ are crossed to produce F₂ plants in which corolla length and variance are measured. The following table summarizes the mean and variance of corolla length in each generation. Calculate H² for corolla length in Nicotiana.

507
views
Textbook Question

In a line of cherry tomatoes, the average fruit weight is 16 g. A plant producing tomatoes with an average weight of 12 g is used in one self-fertilization cross to produce a line of smaller tomatoes, and a plant producing tomatoes of 24 g is used in a second cross to produce larger tomatoes. What is the selection differential (S) for fruit weight in each cross?

436
views
Textbook Question

In a line of cherry tomatoes, the average fruit weight is 16 g. A plant producing tomatoes with an average weight of 12 g is used in one self-fertilization cross to produce a line of smaller tomatoes, and a plant producing tomatoes of 24 g is used in a second cross to produce larger tomatoes. If narrow sense heritability (h²) for this trait is 0.80, what are the expected responses to selection (R) for fruit weight in the crosses?

433
views
Textbook Question

Two pure-breeding wheat strains, one producing dark red kernels and the other producing white kernels, are crossed to produce F₁ with pink kernel color. When an F₁ plant is self-fertilized and its seed collected and planted, the resulting F₂ consists of 160 plants with kernel colors as shown in the following table.

Based on the F₂ progeny, how many genes are involved in kernel color determination?

464
views