


 05:13
05:13
Textbook Question
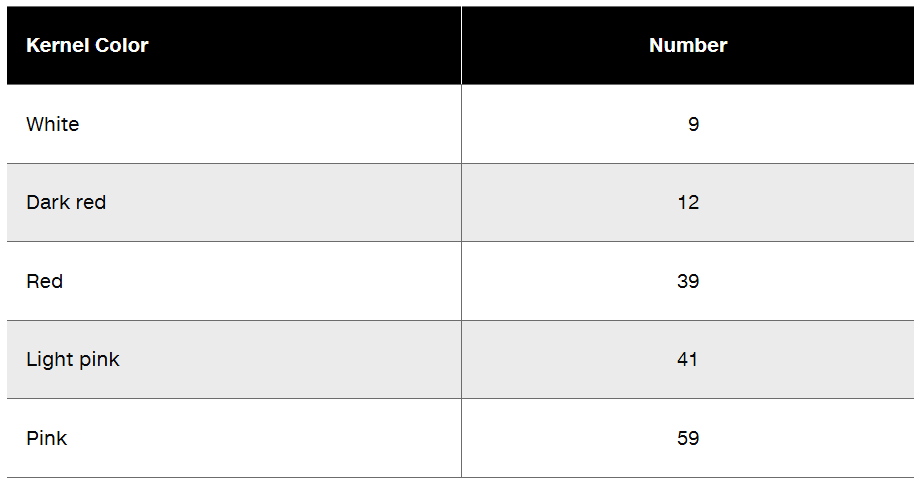
Two pure-breeding wheat strains, one producing dark red kernels and the other producing white kernels, are crossed to produce F₁ with pink kernel color. When an F₁ plant is self-fertilized and its seed collected and planted, the resulting F₂ consists of 160 plants with kernel colors as shown in the following table.
Using clearly defined allele symbols of your choice, give genotypes for the parental strains and the F₁. Describe the genotypes that produce the different phenotypes in the F₂.
470
views