Pearson+ LogoPearson+ Logo
Ch. 4 - Gene Interaction
Sanders - Genetic Analysis: An Integrated Approach 3rd Edition
Sanders3rd EditionGenetic Analysis: An Integrated ApproachISBN: 9780135564172Not the one you use?Change textbook
Chapter 4, Problem 33

Dr. O. Sophila, a close friend of Dr. Ara B. Dopsis, reviews the results Dr. Dopsis obtained in his experiment with iris plants described in Genetic Analysis 4.3. Dr. Sophila thinks the F₂ progeny demonstrate that a single gene with incomplete dominance has produced a 1:2:1 ratio. Dr. Dopsis insists his proposal of recessive epistasis producing a 9:4:3 ratio in the F₂ is correct. To test his proposal, Dr. Dopsis examines the F₂ data under the assumptions of the single-gene incomplete dominance model using chi-square analysis. Calculate and interpret this chi-square value. Can Dr. Dopsis reject the single-gene incomplete dominance model on the basis of this analysis? Explain why or why not.

Verified step by step guidance
1
Step 1: Understand the problem. The goal is to determine whether the F₂ data supports the single-gene incomplete dominance model (1:2:1 ratio) using chi-square analysis. This involves comparing observed data to expected data under the 1:2:1 hypothesis.
Step 2: Calculate the expected values. If the total number of F₂ progeny is given, divide the total into the expected proportions based on the 1:2:1 ratio. For example, if there are N total progeny, the expected numbers for each phenotype would be (1/4)N, (1/2)N, and (1/4)N for the respective phenotypes.
Step 3: Apply the chi-square formula. The chi-square formula is χ² = Σ((O - E)² / E), where O represents the observed values for each phenotype, and E represents the expected values. For each phenotype, calculate the difference between observed (O) and expected (E), square it, divide by the expected value, and sum these values across all phenotypes.
Step 4: Determine the degrees of freedom. The degrees of freedom (df) for a chi-square test is calculated as the number of phenotypic categories minus 1. In this case, there are three categories (1:2:1), so df = 3 - 1 = 2.
Step 5: Compare the chi-square value to the critical value. Using a chi-square distribution table, find the critical value for df = 2 at a chosen significance level (e.g., 0.05). If the calculated χ² value exceeds the critical value, the single-gene incomplete dominance model can be rejected. Otherwise, it cannot be rejected. Interpret the result in the context of the problem.

Verified video answer for a similar problem:

This video solution was recommended by our tutors as helpful for the problem above.
Video duration:
5m
Was this helpful?

Key Concepts

Here are the essential concepts you must grasp in order to answer the question correctly.

Incomplete Dominance

Incomplete dominance is a genetic phenomenon where the phenotype of heterozygotes is intermediate between those of the homozygotes. This results in a blending of traits, leading to a 1:2:1 phenotypic ratio in the offspring when two heterozygous individuals are crossed. For example, crossing red and white flowers may produce pink flowers, illustrating this concept.
Recommended video:
Guided course
04:37
Variations on Dominance

Epistasis

Epistasis refers to the interaction between genes where the expression of one gene is masked or modified by another gene. In the case of recessive epistasis, a homozygous recessive genotype at one locus can prevent the expression of alleles at a second locus, leading to a modified phenotypic ratio, such as 9:4:3 in the F₂ generation. This concept is crucial for understanding complex inheritance patterns.
Recommended video:
Guided course
13:08
Epistatic Genes

Chi-Square Analysis

Chi-square analysis is a statistical method used to determine if there is a significant difference between observed and expected frequencies in categorical data. In genetics, it helps assess whether the observed ratios of phenotypes fit a specific inheritance model, such as incomplete dominance or epistasis. A high chi-square value indicates a significant deviation from the expected ratio, which can lead to rejecting a hypothesis.
Recommended video:
Guided course
02:48
Chi Square Analysis
Related Practice
Textbook Question

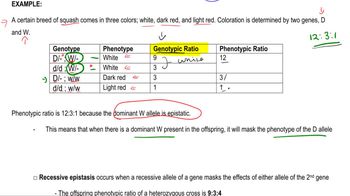
Dr. Ara B. Dopsis and Dr. C. Ellie Gans are performing genetic crosses on daisy plants. They self-fertilize a blue-flowered daisy and grow 100 progeny plants that consist of 55 blue-flowered plants, 22 purple-flowered plants, and 23 white-flowered plants. Dr. Dopsis believes this is the result of segregation of two alleles at one locus and that the progeny ratio is 1:2:1. Dr. Gans thinks the progeny phenotypes are the result of two epistatic genes and that the ratio is 9:3:4.

The two scientists ask you to resolve their conflict by performing chi-square analysis on the data for both proposed genetic mechanisms. For each proposed mechanism, fill in the values requested on the form the researchers have provided for your analysis.


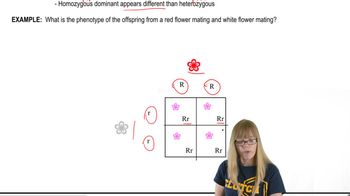
What is your conclusion regarding these two genetic hypotheses: the 1:2:1 hypothesis and the 9:3:4 hypothesis?

476
views
Textbook Question

Human ABO blood type is determined by three alleles, two of which (I^A and I^B) produce gene products that modify the H antigen produced by protein activity of an independently assorting H gene. A rare abnormality known as the 'Bombay phenotype' is the result of epistatic interaction between the gene for the ABO blood group and the H gene. Individuals with the Bombay phenotype appear to have blood type O based on the inability of both anti-A antibody and anti-B antibody to detect an antigen. The apparent blood type O in Bombay phenotype is due to the absence of H antigen as a result of homozygous recessive mutations of the H gene. Individuals with the Bombay phenotype have the hh genotype. Use the information above to make predictions about the outcome of the cross shown below.

IᴬIᴮHh×IᴬIᴮHh

1400
views
Textbook Question

In rabbits, albinism is an autosomal recessive condition caused by the absence of the pigment melanin from skin and fur. Pigmentation is a dominant wild-type trait. Three pure-breeding strains of albino rabbits, identified as strains 1, 2, and 3, are crossed to one another. In the table below, F₁ and F₂ progeny are shown for each cross. Based on the available data, propose a genetic explanation for the results. As part of your answer, create genotypes for each albino strain using clearly defined symbols of your own choosing. Use your symbols to diagram each cross, giving the F₁ and F₂ genotypes. <>

996
views
Textbook Question

In a breed of domestic cattle, horns can appear on males and on females. Males and females can also be hornless. The following crosses are performed with parents from pure-breeding lines.

Explain the inheritance of this phenotype in cattle, and assign genotypes to all cattle in each cross.

481
views
Textbook Question

Cross-1 shown in the following figure illustrates genetic complementation of flower-color mutants. The produced from this cross of two pure-breeding mutant parental plants are dihybrid (CcPp) and have wild-type flower color. If these F₁ are allowed to self-fertilize, what phenotypes are expected in the F₂ , and what are the expected ratios of the phenotypes?


460
views
Textbook Question

The wild-type allele of a gene has an A–T base pair at a particular location in its sequence, and a mutant allele of the same gene has a G–C base pair at the same location. Otherwise, the sequences of the two alleles are identical. Does this information tell you anything about the dominance relationship of the alleles? Explain why or why not.

494
views