


 07:33
07:33

Textbook Question
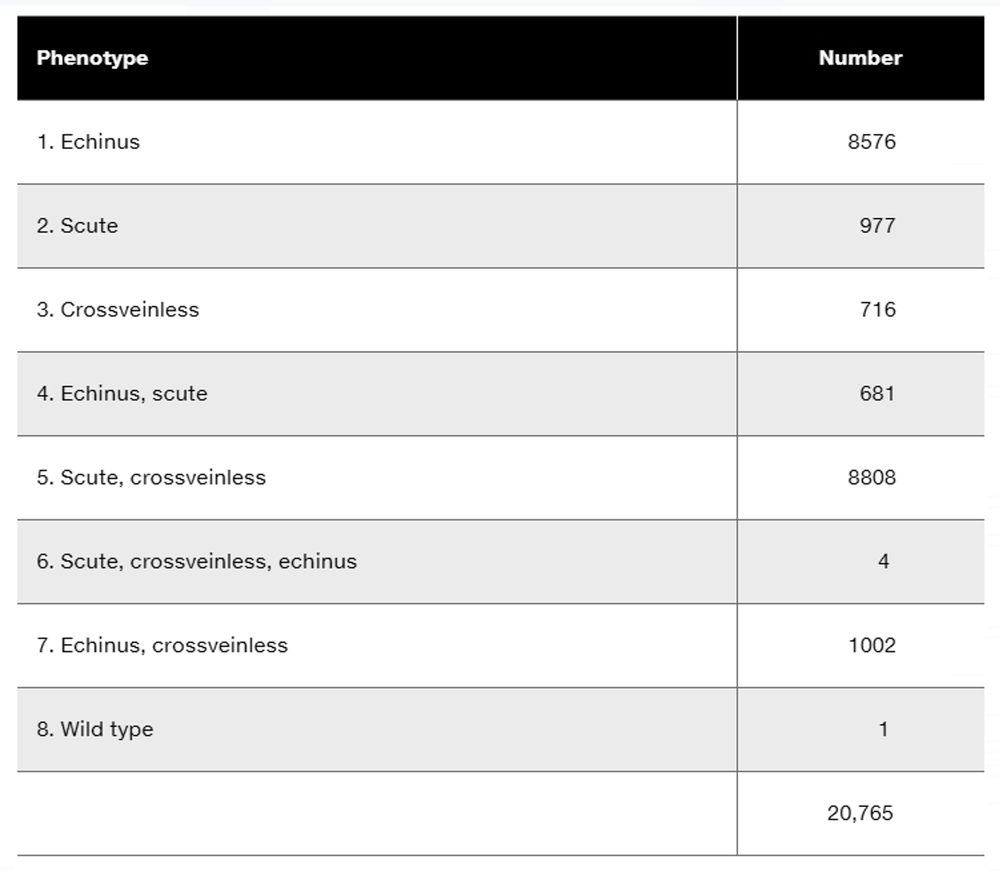
A Drosophila experiment examining potential genetic linkage of X-linked genes studies a recessive eye mutant (echinus), a recessive wing-vein mutation (crossveinless), and a recessive bristle mutation (scute). The wild-type phenotypes are dominant. Trihybrid wild-type females (all have the same genotype) are crossed to hemizygous males displaying the three recessive phenotypes. Among the 20,765 progeny produced from these crosses are the phenotypes and numbers listed in the table. Any phenotype not given is wild type.
Determine the gene order and identify the alleles on the homologous X chromosomes in the trihybrid females.
497
views