14. Predictive Statistics: The Normal Curve and Regression
Finding Percents of Data for The Normal Distribution
14. Predictive Statistics: The Normal Curve and Regression
Finding Percents of Data for The Normal Distribution
 06:25


Showing 11 of 11 videos
Practice this topic
- Multiple Choice
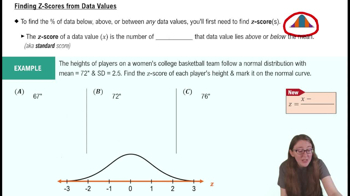
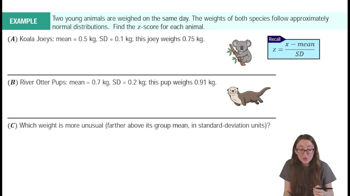
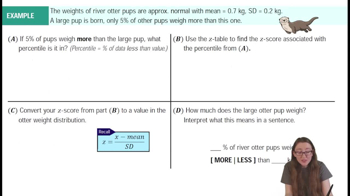
A wildlife vet says a river otter pup's weight is 1.5 standard deviations below the mean weight for otter pups at the refuge. What is the z-score for this pup's weight?
- Multiple Choice
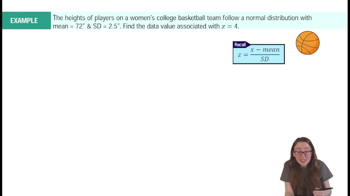
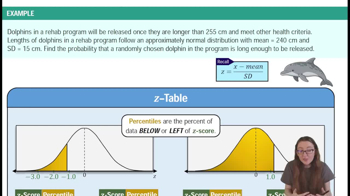
Lengths of dolphins in a coastal population are approximately normally distributed with mean = 240 cm and SD = 15 cm. Find the standard score for a dolphin that is 255 cm long.
- Multiple Choice
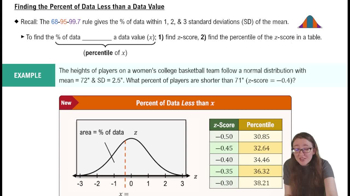
Use the z-table to find the percent of data below .
- Multiple Choice
Use the z-table to find the area to the left of .