14. Predictive Statistics: The Normal Curve and Regression
Linear Regression
14. Predictive Statistics: The Normal Curve and Regression
Linear Regression
 05:54



Practice this topic
- Multiple Choice
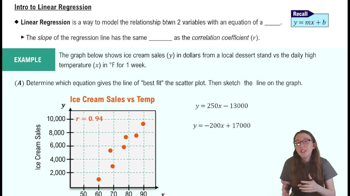
Select the correlation coefficient that best matches a data set with strong correlation and the regression line: .
1views - Multiple Choice
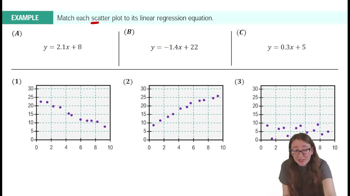
The scatterplot below shows a set of data and its least-squares regression line. Based on the graph, which of the following is most likely the equation of the regression line?
- Multiple Choice
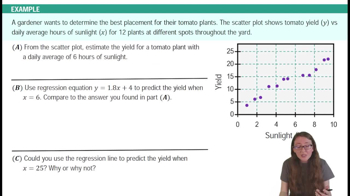
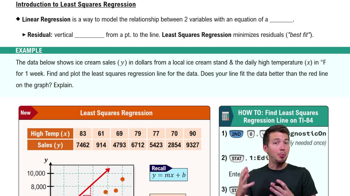
A regional sales manager records data on the number of clients a salesperson contacts in a week (x) and the total sales generated that week (y). The data from 10 salespeople is shown below. Find the equation of the regression line and use it to predict sales if the salesperson contacts (a) 6 clients; (b) 40 clients.