Teaching and Learning blog

Explore insights, trends, and research that impact teaching, learning, and leading.

Explore posts in other areas.

PreK-12Pearson studentsProfessional

  • Wheel of a craps table after being spun.

    Statistics Tables: Roulette and the Gambler’s Fallacy

    By Eric Nielsen

    This series of statistical examples is intended to inform students about the statistics and psychological ploys that casinos use on table games to make them more informed consumers. The aim of this series is to provide real-life examples of what students often only see as calculations on a page, or a topic in a textbook. This series is not intended to be a “how to beat the house” or any other sort of get rich quick scheme. If I had a way to beat the house, don’t you think I would be doing it and not giving up the secrets? Overall, it is good to think of casino games as good forms of entertainment, and you are encouraged to treat them as such. If you have or know someone who has a gambling problem, please use resources, and reach out to a professional for help.

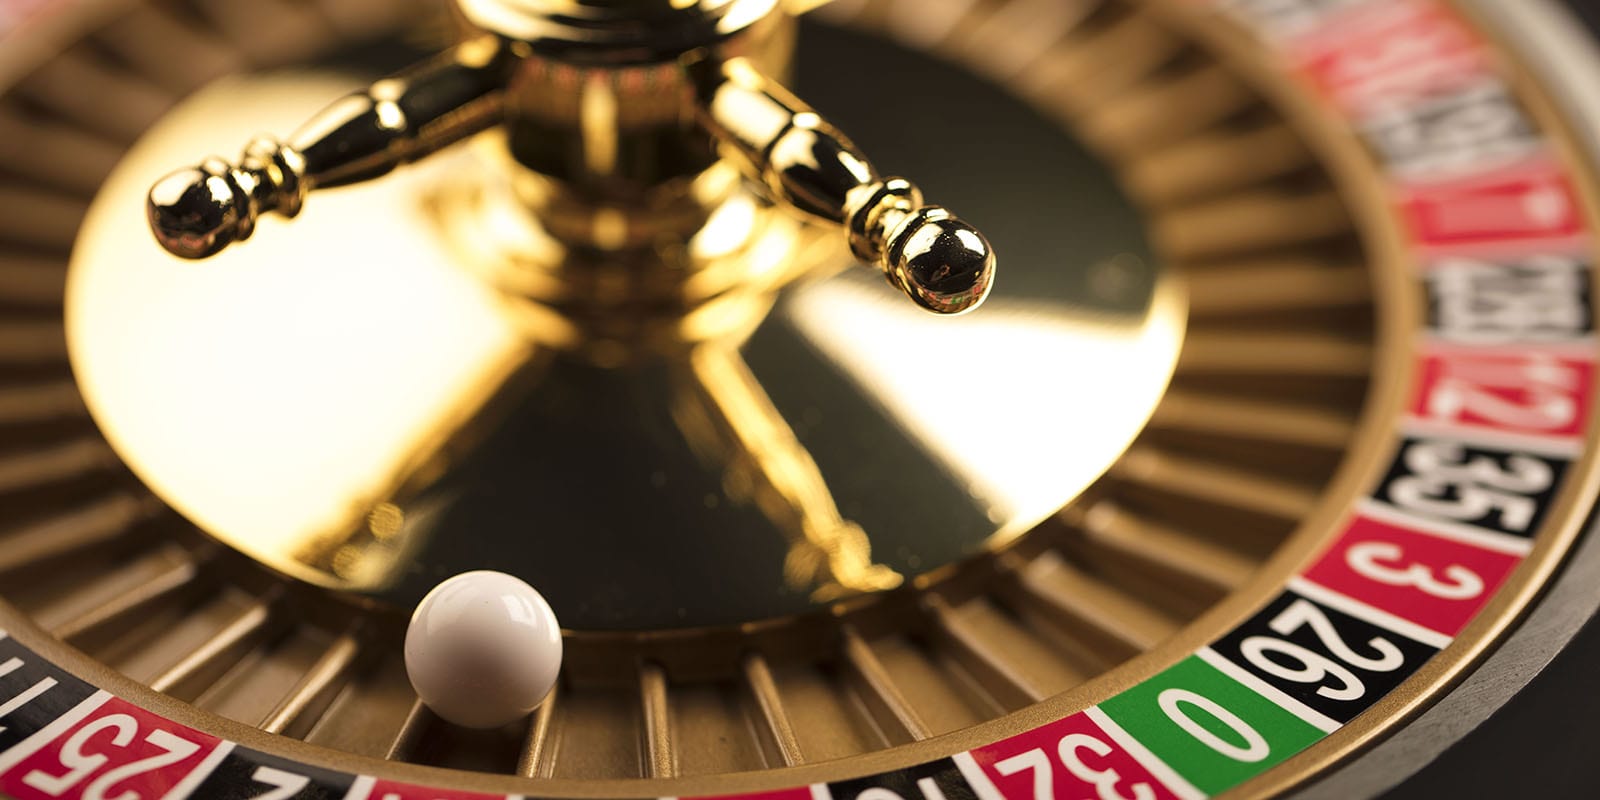
    Students often have a hard time conceptualizing independent events when calculating probabilities. The standard textbook example is to provide a probability matrix of events A and B along with their complements and have students compute the equation P(A|B)= P(A). Instead, let’s take the students back into the casino, this time to the Roulette table. The game is rather simple: a spinning wheel, with separated landing pockets distinguished by number and color, and ball are set in motion in opposite directions with the ball coming to rest in one of the 38 for an American Roulette wheel (or 37 for European Roulette, or 39 for Triple Zero Roulette wheels) numbered pockets. This example stays away from betting and different techniques and instead focuses on the simplistic spinning of the wheel to create the event. Any of the options that get the player closest to 50% on the Roulette Wheel can be used: Red/Black, Even/Odd, or 1-18/19-36. These options are all not 50% because of the inclusion of the 2 green 0 and 00 pockets (neither red/black, or even/odd, or between 1-18/19-36). The number and color of the pocket the ball lands in can be bet on using the different “outside spots” on the table (not a truly 50% bet since there are 18 red and 18 black and 38 spots on an American Roulette wheel 47.368%).

  • Multi-colored, transparent dice arranged in rows and columns to create the image of a rectangle.

    Statistics Tables: Craps for the Normal Distribution

    By Eric Nielsen

    This series of statistical examples is intended to inform students about the statistics (and how it relates to the psychology) casinos use on table games to make them a more informed consumer. This series is not intended to be a “how to beat the house” or any other sort of get rich quick scheme. If I had a way to beat the house, don’t you think I would be doing it and not giving up the secrets? Overall, it is good to think of casino games as forms of entertainment, and you are encouraged to treat them as such. If you have or know someone who has a gambling problem, please use resources, and reach out to a professional for help.

    Often students do not have a concept for the Normal Distribution when it comes to the sampling chapter, and the Galton Board is used to give students the visual reference in the classroom for discrete random variables showing a normal distribution when enough observations are dropped through the board. Unless students are soon to be contestants on The Price Is Right and are faced with Plinko, or NBC’s game show The Wall, they are not likely to encounter the board in their life outside the class. A more accessible way for students to see the normal distribution and understand the importance of sample size is the Craps Table.

     The casino game of Craps is simplistic: the act of throwing two dice and summing up the showing faces is the experiment in the game of craps. While using the full casino game with payouts and their corresponding probabilities creates a valued learning activity, this activity focuses only on the act of rolling the dice. To emphasize the previous chapters (discrete random variables categorization and visualization)  the image below shows the number of ways the dice total can occur: