Statistics Tables: Roulette and the Gambler’s Fallacy
This series of statistical examples is intended to inform students about the statistics and psychological ploys that casinos use on table games to make them more informed consumers. The aim of this series is to provide real-life examples of what students often only see as calculations on a page, or a topic in a textbook. This series is not intended to be a “how to beat the house” or any other sort of get rich quick scheme. If I had a way to beat the house, don’t you think I would be doing it and not giving up the secrets? Overall, it is good to think of casino games as good forms of entertainment, and you are encouraged to treat them as such. If you have or know someone who has a gambling problem, please use resources, and reach out to a professional for help.
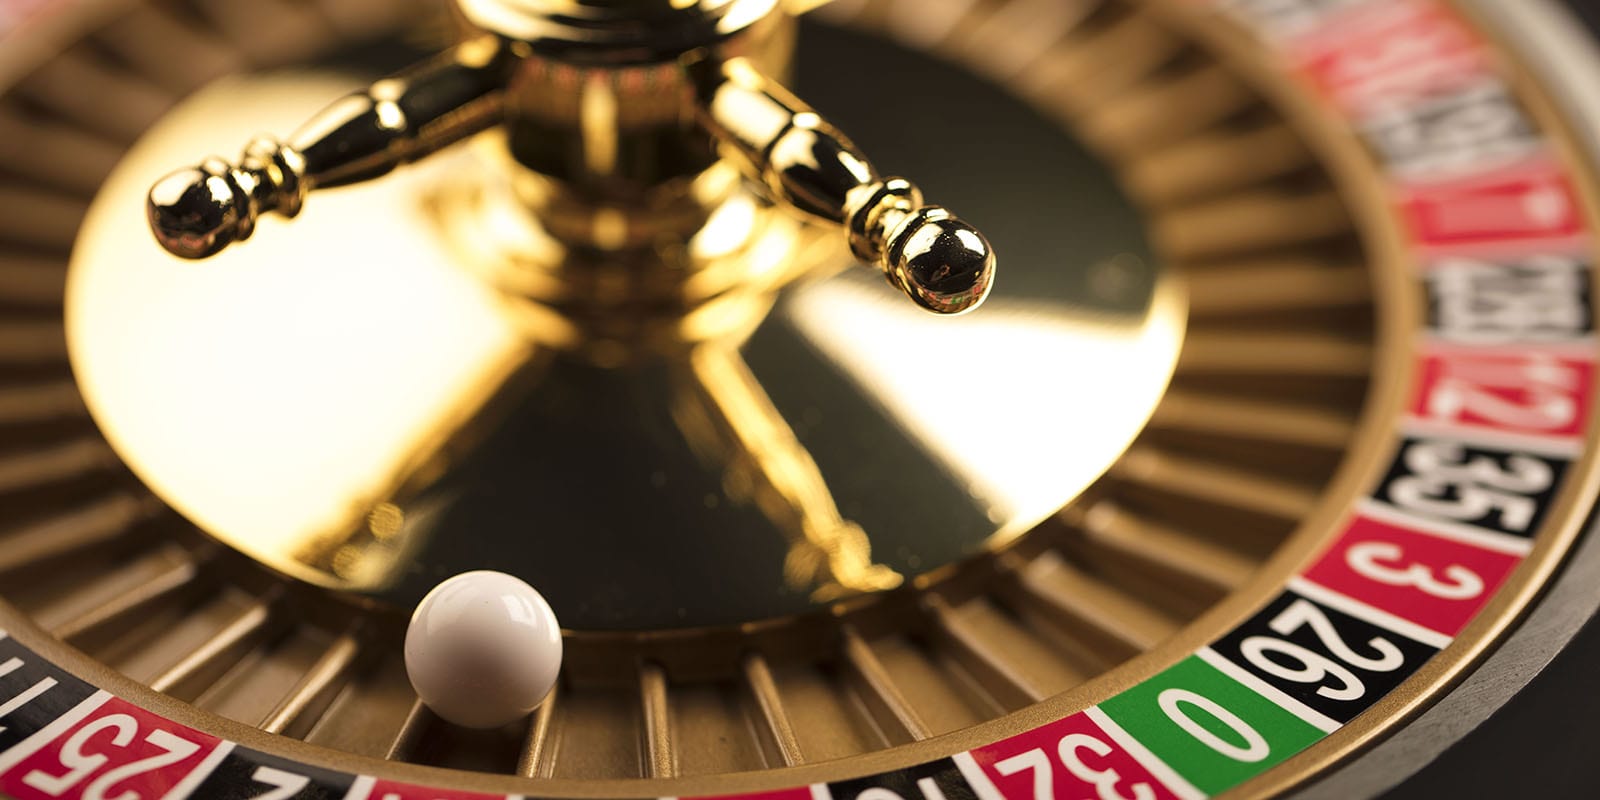
Students often have a hard time conceptualizing independent events when calculating probabilities. The standard textbook example is to provide a probability matrix of events A and B along with their complements and have students compute the equation P(A|B)= P(A). Instead, let’s take the students back into the casino, this time to the Roulette table. The game is rather simple: a spinning wheel, with separated landing pockets distinguished by number and color, and ball are set in motion in opposite directions with the ball coming to rest in one of the 38 for an American Roulette wheel (or 37 for European Roulette, or 39 for Triple Zero Roulette wheels) numbered pockets. This example stays away from betting and different techniques and instead focuses on the simplistic spinning of the wheel to create the event. Any of the options that get the player closest to 50% on the Roulette Wheel can be used: Red/Black, Even/Odd, or 1-18/19-36. These options are all not 50% because of the inclusion of the 2 green 0 and 00 pockets (neither red/black, or even/odd, or between 1-18/19-36). The number and color of the pocket the ball lands in can be bet on using the different “outside spots” on the table (not a truly 50% bet since there are 18 red and 18 black and 38 spots on an American Roulette wheel 47.368%).

Casinos frequently provide the players with the history of previous spins by posting the results of the previous spins above the wheel in the hopes of attracting more players to the game. The casino would never give away an edge, so they must know something about giving away this information: it doesn’t matter! Each spin of the roulette wheel is independent; knowing that the last 10 spins have all resulted in even numbers, or low (1-18) numbers, or black pockets in no way impacts the probability that the next spin will be an odd number or high (19-36) numbers, or red pockets.
The Gambler’s Fallacy happens when a conclusion of a series of independent events is incorrectly reached by supposing that independent events are causally related. The fallacy is experienced, in this example, when the individual expects the outcome of a next spin to be influenced by the previous spins. Specifically, the uninformed casino player believes that the black number is “due to hit” after a long sequence of red numbers has just occurred because of the false belief that the probability of the landing in the black pocket occurring is now greater than 50%; even though the odds of getting a red or black pocket remain the same on each spin (the definition of independent events). The gambler falsely expects the sequence of previous events to now make the complement event better than 50% chance to happen to balance out the sequence back to 50% (for these red/black, high/low, or even/odd outcomes).
The odds of getting 6 reds in a row (18/38)^6= 1.13%. But because the probability of getting many of the same events in a sequence seems low does not mean it cannot happen or continue happening.

There can be long strings of one of these outcomes in the history of spin outcomes, because the previous action of the wheel has no impact on future outcomes. The simple fact is that the wheel has no memory of where the previous spin landed, but gamblers do, and that is what the casino is counting on!
For the roulette wheel to no longer be independent, the casino operator would have to put a barrier over the pocket where the ball has previously landed (making it impossible to land in that pocket again). In this modified version of roulette the number of reds decreases with each red outcome and changes the odds that a red pocket will be landed in. To get 6 reds in a row now can be found by (18/38)*(17/38)*(16/38)*(15/38)*(14/38)*(13/38).

About the author

Eric Nielsen
Eric Nielsen started at St Louis Community College in 2008, where he teaches classes in Economics and Statistics. He earned his Bachelor’s Degree from Pitzer College along with a Master’s and Doctoral Degrees from Claremont Graduate University in Claremont, CA. When not teaching, Eric enjoys spending time with his wife, children and dogs. Occasionally they find ways to escape from the children, through swimming, biking and running with the dogs.