Phase Diagram
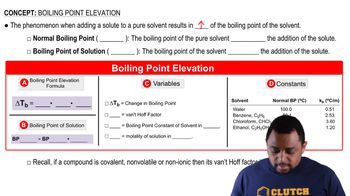
A phase diagram is a graphical representation that shows the phases of a substance as a function of temperature and pressure. It illustrates the boundaries between different phases, such as solid, liquid, and gas, and indicates the conditions under which these phases coexist. In the context of solutions, phase diagrams can also depict the effects of solutes on the boiling and freezing points of solvents.


 Verified step by step guidance
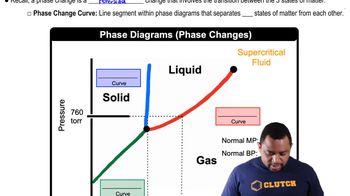
 03:22
03:22