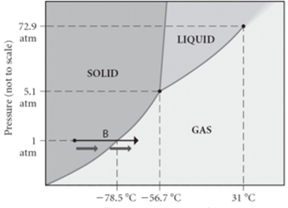
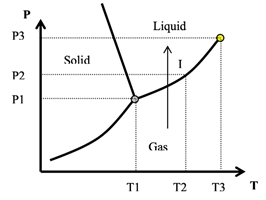
Phase Diagrams show what effect temperature and pressure have on a pure substance in a closed system without any air.
Phase Diagrams
1
concept
States of Matter of Phase Diagrams
3m
Play a video:
Was this helpful?
Hey everyone. So a phase diagram represents a map of the physical state of a pure substance as a function of pressure, which is on our Y axis and temperature which is on our X axis. If we take a look here at a typical phase diagram here, we have our pressure and it's on Ry and then down here is our temperature which is X. We're going to stay here that we have different portions of the face diagram that you need to become familiar with in order to fully understand what happens to any pure substance as we play around with its temperature and pressure. Now here we're going to say a triple point. This is a unique set of conditions where three states of matter are stable and an equilibrium with one another for us to identify the triple point, we first need to realize that three states of matter represented on a typical phase diagram. So we take a look here, let's say, we're starting off within this area of our phase diagram in this area, we would say that our pressure is higher and our temperature is lower. These conditions are ideal for the solid form of a pure of pure substance. So here we have our solid, if we start to increase our temperature, we can have our solid basically melt into a liquid. So here we have our liquid phase within this region and then finally, if we keep pushing the envelope in terms of temperature if we want or we decrease the pressure greatly, we go into the gaseous state. So here this is our gaseous state here. Now our solid liquid and gas, they all meet here at .1 .1 here represents our triple point next we have our critical point. This is just our final set of pressure and temperature conditions where a liquid and gas are distinguishable. So where a liquid and gas are distinguishable. So if we take a look here, .2 represents my critical point and again, this is our triple point. So at this critical point, our basically our pressure is pretty high up there and our temperature is pretty high. If we keep moving towards this direction though, we're gonna go to a place where it's no longer a liquid, it's no longer a gas. It becomes something called a supercritical fluid. Now, if you want to think about what's a good example of a supercritical fluid. Now, if you've watched television and movies, you'll see every time we have like space explorations towards the sun, you can see the sun being depicted as like, like lava or something close to that. In reality the sun is made up of hydrogen gas. If that's such a high temperature and pressure that it kind of looks a little bit like lava, but it's not exactly liquid. It's not exactly a gas, it's supercritical fluid. So just remember when we're looking at a typical phase diagram, these are the portions. You need to remember where we have our pressure on the y, our temperature on the X axis, we have are solid liquid and gas phases phases within their different sectors, and then we have our triple point, which connects are three phases together, and then finally our critical point. Beyond that point, we're no longer a liquid or a gas, but instead a supercritical fluid.
2
example
Phase Diagrams Example 1
1m
Play a video:
Was this helpful?
Here. The example question states at a temperature of 60°C and 1. atmospheres determine the physical state of the substance from the Phase Diagram shown above. Alright, so we're dealing with 6°C, which we know is somewhere between 50°C here and 80. Next they tell me that on the pressure 1.20 atmospheres. Well, if we take a look here on our Y axis, we have 760 tour, Remember 760. Tour represents one atmosphere, But here we have a pressure of 1.20, which means our pressure is above this line here, So our pressure is higher than 760. Tour And the temperature is around 60. So we can approximate this looks around 60 or so, and it'll be somewhere above this line, so it'll fall within this sector of my phase diagram. And if we look, that means it resides within the liquid phase. So here, my answer would be option. A The unknown substance would be a liquid when the temperature is 60 degrees Celsius and 1.20 atmosphere based on the phase diagram shown before us
3
Problem
The critical point of this substance occurs at what temperature?
A
0°C
B
–78.5°C
C
–56.7°C
D
31°C
E
100°C
4
concept
Phase Diagrams Concept 2
3m
Play a video:
Was this helpful?
we're not going to take a look at the phase changes associated with the typical phase diagram. Now recall that a phase change is a reversible change. It involves a transition between the three states of matter, solids, liquids and gasses, we're gonna say associated with this phase change is what we call a phase change curve. This is just our line segment within phase diagrams that separates three states of matter. Uh Two states of matters to states of matter from each other. So if we take a look here at this typical phase diagram, we have our solids or liquids and gasses were going to say here that in this blue line, we're separating the solid phase from the liquid phase. Now, if you think about it, what do we call going from a solid to a liquid? We call that melting and in chemistry of fancier term forward is fusion. So we're gonna say here that this is our melting or we call our fusion curve For the Green one. Were separated separating the solid phase from the gaseous phase. If we think about it, what do we call gorn from a solid to a gas. So we've talked about this several chapters ago, going from a solid to a gas is called sublimation. So this green line will be our sublimation curve. And then finally we have our liquid and our gas faces being separated by this red line. Thinking about going from a liquid to a gas that's vaporization. So this is our vaporization curved. Now with this whole idea of phase changes. We have involved are normal pressure. So normal pressure is 762 or or 760 of mercury or just one atmosphere. We're going to stay here. That no pressure Is the name given to the standard pressure of one atmosphere or 760 of Mercury or tour. And associated with normal pressure, we have normal melting point and normal boiling point. Normal melting point is the phase transition between a solid to a liquid at normal pressure. And normal boiling point would just be the phase transition between a liquid to a gas at normal pressure. Now, how to be able to see that on this typical phase diagram? Well here is our normal pressure. And what I'm gonna do here is I'm going to trace to this blue line. Remember at this blue line is where we have the transition between solid to liquid. So this line is where melting can occur if we trace it down From there we hit 50°C, 50°C represents our normal melting point temperature. Now boiling has to do with us going from liquid to gas. So again, continuing tracing, We hit this red line here where vaporization can occur. And then you just trace down Here, we get 80°80° here would represent the normal boiling point of this substance. Right? So just remember the different types of phase change curves that are associated with any typical phase diagram. And remember if we know the normal pressure, we can apply that to find our normal melting point and our normal boiling point for any given substance.
5
example
Phase Diagrams Example 2
1m
Play a video:
Was this helpful?
Here, we're told that a substance has a triple point of negative 45°C and 500 of mercury. What is the most likely face change to occur for a solid sample of this substance as it's heated from negative 60°C to 10°C at a pressure of 490 of mercury. Alright, so first of all, they tell us our triple point and on this phase diagram, our triple point would be here, The point in which all three phases meet together. Now, if we take a look, we're told that it happens at 500 m mm of mercury And at negative 45°. Now they're telling us the The whole new pressure is a little bit lower than that, it's at 4 90. It's a little different. Not much different, but it's a little different. And we're starting at -60. So let's say -60 is here. And then let's say that 10°C is over here. It doesn't really matter in terms of spacing, we know that negative 60 is going to be to the left of negative 45 and we know 10°C will be to the right, we know that we're starting out as a solid. So we know we're somewhere within this space here and we're just traveling From our solid phase and getting to 10°C, which is over here. Remember if we were to basically suction off the different phases phases of our phase diagram. We have our solid, our liquid and our gas. We just went from the solid phase, We skipped the liquid phase and ended up in the gaseous phase. Remember going from a solid straight to a gas, we call that sublimation. That would mean that option E is our correct answer.
6
Problem
Arrow I corresponds to:
A
Equilibrium
B
Sublimation
C
Condensation
D
Vaporization
E
Deposition
7
Problem
What is the normal freezing point of this unknown substance?
A
0°C
B
–200°C
C
200°C
D
400°C
E
100°C
8
Problem
At what temperature can we no longer tell the difference between the liquid and gas phases?
A
100°C
B
200°C
C
400°C
D
800°C
E
820°C
Additional resources for Phase Diagrams
PRACTICE PROBLEMS AND ACTIVITIES (32)
- Using this graph of CS2 data, determine (a) the approximate vapor pressure of CS2 at 30°C,
- The phase diagram of a hypothetical substance is (b) What is the physical state of the substance under the fo...
- This portion of a phase diagram shows the vapor–pressure curves of a volatile solvent and of a solution of tha...
- At standard temperature and pressure, the molar volumes of Cl2 and NH3 gases are 22.06 and 22.40 L, respective...
- Benzoic acid, C6H5COOH, melts at 122 °C. The density in the liquid state at 130 °C is 1.08 g/cm3. The density ...
- A phase diagram for a substance that exhibits the liquid crystalline state is shown. (b) If the substance is ...
- The following compound undergoes a phase transition from the solid to the smectic liquid crystal phase at 121 ...
- Assume that you have a sample of gas at 350 K in a sealed container, as represented in (a). Which of the drawi...
- The following phase diagram shows part of the liquid–vapor phase-transition boundaries for two solutions of eq...
- Water at room temperature is placed in a flask connected by rubber tubing to a vacuum pump, and the pump is tu...
- (a)Two pans of water are on different burners of a stove.One pan of water is boiling vigorously, while the oth...
- You are high up in the mountains and boil water to make some tea. However, when you drink your tea, it is not ...
- Using the vapor-pressure curves in Figure 11.25, (d) estimate the external pressure at which diethyl ether wil...
- Appendix B lists the vapor pressure of water at various external pressures. (c) A city at an altitude of 5000 ...
- (b) Could you measure the triple point of water by measuring the temperature in a vessel in which water vapor,...
- Referring to Figure 11.29, describe the phase changes (and the temperatures at which they occur) when CO2 is h...
- The phase diagram for neon is Use the phase diagram to answer the following questions. (a) What is the approx...
- Benzene has a melting point of 5.53 °C and a boiling point of 80.09 °C at atmospheric pressure. Its density is...
- Use the phase diagram of neon to answer the following questions. (b) What can you say about the strength of th...
- At 25 °C gallium is a solid with a density of 5.91 g/cm3. Its melting point, 29.8 °C, is low enough that you c...
- Consider the phase diagram shown here. Identify the states present at points a through g.
- The table below lists the density of O2 at various tempera-tures and at 1 atm. The normal melting point of O2 ...
- Nitrogen has a normal boiling point of 77.3 K and a melting point (at 1 atm) of 63.1 K. Its critical temperat...
- Argon has a normal boiling point of 87.2 K and a melting point (at 1 atm) of 84.1 K. Its critical temperature...
- Substance X has a vapor pressure of 100 mm Hg at its triple point (48 °C). When 1 mol of X is heated at 1 atm ...
- The phase diagram for sulfur is shown here. The rhombic and monoclinic states are two solid states with differ...
- Naphthalene (C10H8) is the main ingredient in traditional mothballs. Its normal melting point is 81 °C, its no...
- A particular liquid crystalline substance has the phase diagram shown in the figure. By analogy with the phase...
- Liquid butane (C4H10) is stored in cylinders to be used as a fuel. The normal boiling point of butane is liste...
- Based on the phase diagram of CO2 shown in Figure 11.39(b), describe the state changes that occur when the tem...
- Draw a phase diagram showing how the phase boundaries differ for a pure solvent compared with a solution.