


 07:33
07:33
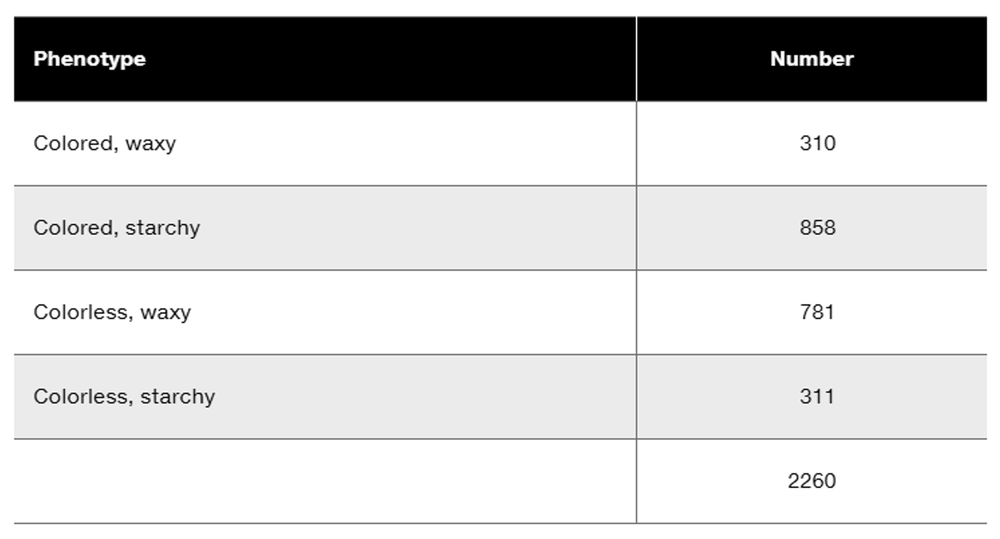
In experiments published in 1918 that sought to verify and expand the genetic linkage and recombination theory proposed by Morgan, Thomas Bregger studied potential genetic linkage in corn (Zea mays) for genes controlling kernel color (colored is dominant to colorless) and starch content (starchy is dominant to waxy). Bregger performed two crosses. In Cross 1, pure-breeding colored, starchy-kernel plants (C1 Wx/C1 Wx) were crossed to plants pure-breeding for colorless, waxy kernels (c1 wx/c1 wx). The F₁ of this cross were test-crossed to colorless, waxy plants. The test-cross progeny were as follows:
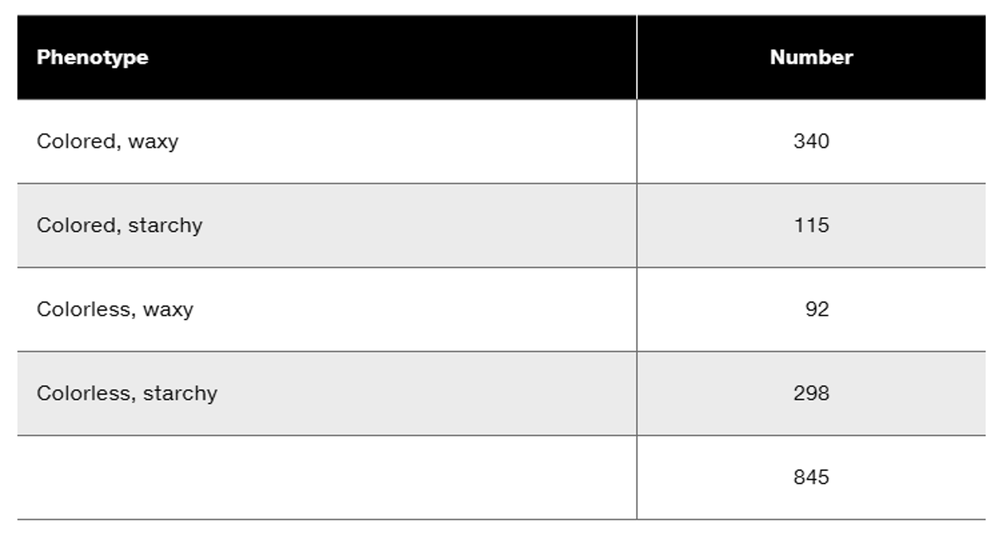
In Cross 2, plants pure-breeding for colored, waxy kernels (C1 wx/C1 wx) and colorless, starchy kernels (c1 Wx/c1 Wx) were mated, and their F₁ were test-crossed to colorless, waxy plants. The test-cross progeny were as follows:
For each set of test-cross progeny, determine whether genetic linkage or independent assortment is more strongly supported by the data. Explain the rationale for your answer.