Back
BackProblem 8.2.34c
Using Confidence Intervals to Test Hypotheses When analyzing the last digits of telephone numbers in Port Jefferson, it is found that among 1000 randomly selected digits, 119 are zeros. If the digits are randomly selected, the proportion of zeros should be 0.1.
c. Use the sample data to construct a 95% confidence interval estimate of the proportion of zeros. What does the confidence interval suggest about the claim that the proportion of zeros equals 0.1?
Problem 8.5.1c
RESAMPLING
c. When testing a claim about a proportion or mean or standard deviation, what is an important advantage of using a resampling method instead of the parametric method described in the preceding sections of this chapter?
Problem 8.c.1e
Lightning Deaths Listed below are the numbers of deaths from lightning strikes in the United States each year for a sequence of recent and consecutive years. Find the values of the indicated statistics.
46 51 44 51 43 32 38 48 45 27 34 29 26 28 23 26 28 40 16 20
e. Range
Problem 8.2.34d
Using Confidence Intervals to Test Hypotheses When analyzing the last digits of telephone numbers in Port Jefferson, it is found that among 1000 randomly selected digits, 119 are zeros. If the digits are randomly selected, the proportion of zeros should be 0.1.
d. Compare the results from the critical value method, the P-value method, and the confidence interval method. Do they all lead to the same conclusion?
Problem 9
Technology
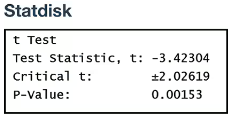
In Exercises 9–12, test the given claim by using the display provided from technology. Use a 0.05 significance level. Identify the null and alternative hypotheses, test statistic, P-value (or range of P-values), or critical value(s), and state the final conclusion that addresses the original claim.
Peanut Butter Cups Data Set 38 “Candies” includes weights of Reese’s peanut butter cups. The accompanying Statdisk display results from using all 38 weights to test the claim that the sample is from a population with a mean equal to 8.953 g.
Problem 11
Technology
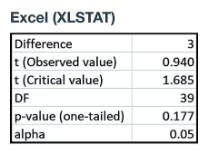
In Exercises 9–12, test the given claim by using the display provided from technology. Use a 0.05 significance level. Identify the null and alternative hypotheses, test statistic, P-value (or range of P-values), or critical value(s), and state the final conclusion that addresses the original claim.
Tower of Terror Data Set 33 “Disney World Wait Times” includes wait times (minutes) for the Tower of Terror ride at 5:00 PM. Using the first 40 times to test the claim that the mean of all such wait times is more than 30 minutes, the accompanying Excel display is obtained.
Problem 13
Testing Hypotheses
In Exercises 13–24, assume that a simple random sample has been selected and test the given claim. Unless specified by your instructor, use either the P-value method or the critical value method for testing hypotheses. Identify the null and alternative hypotheses, test statistic, P-value (or range of P-values), or critical value(s), and state the final conclusion that addresses the original claim.
Systolic Blood Pressure Systolic blood pressure levels above 120 mm Hg are considered to be high. For the 300 systolic blood pressure levels listed in Data Set 1 “Body Data” from Appendix B, the mean is 122.96000 mm Hg and the standard deviation is 15.85169 mm Hg. Use a 0.01 significance level to test the claim that the sample is from a population with a mean greater than 120 mm Hg.
Problem 14
Testing Hypotheses
In Exercises 13–24, assume that a simple random sample has been selected and test the given claim. Unless specified by your instructor, use either the P-value method or the critical value method for testing hypotheses. Identify the null and alternative hypotheses, test statistic, P-value (or range of P-values), or critical value(s), and state the final conclusion that addresses the original claim.
Diastolic Blood Pressure Diastolic blood pressure levels of 60 mm Hg or lower are considered to be too low. For the 300 diastolic blood pressure levels listed in Data Set 1 “Body Data” from Appendix B, the mean is 70.75333 mm Hg and the standard deviation is 11.61618 mm Hg. Use a 0.01 significance level to test the claim that the sample is from a population with a mean greater than 60 mm Hg.
Problem 16
Testing Hypotheses
In Exercises 13–24, assume that a simple random sample has been selected and test the given claim. Unless specified by your instructor, use either the P-value method or the critical value method for testing hypotheses. Identify the null and alternative hypotheses, test statistic, P-value (or range of P-values), or critical value(s), and state the final conclusion that addresses the original claim.
Taxi Fares For the first 40 taxi fares (dollars) listed in Data Set 32 “Taxis” from Appendix B, the mean is $12.035 and the standard deviation is $8.361. Use a 0.05 significance level to test the claim that the mean cost of a taxicab ride in New York City is less than $15.00.
Problem 17
Testing Hypotheses
In Exercises 13–24, assume that a simple random sample has been selected and test the given claim. Unless specified by your instructor, use either the P-value method or the critical value method for testing hypotheses. Identify the null and alternative hypotheses, test statistic, P-value (or range of P-values), or critical value(s), and state the final conclusion that addresses the original claim.
Is the Diet Practical? When 40 people used the Weight Watchers diet for one year, their mean weight loss was 3.0 lb and the standard deviation was 4.9 lb (based on data from “Comparison of the Atkins, Ornish, Weight Watchers, and Zone Diets for Weight Loss and Heart Disease Reduction,” by Dansinger et al., Journal of the American Medical Association, Vol. 293, No. 1). Use a 0.01 significance level to test the claim that the mean weight loss is greater than 0. Based on these results, does the diet appear to have statistical significance? Does the diet appear to have practical significance?
Problem 21
Testing Hypotheses
In Exercises 13–24, assume that a simple random sample has been selected and test the given claim. Unless specified by your instructor, use either the P-value method or the critical value method for testing hypotheses. Identify the null and alternative hypotheses, test statistic, P-value (or range of P-values), or critical value(s), and state the final conclusion that addresses the original claim.
Lead in Medicine Listed below are the lead concentrations (in ) measured in different Ayurveda medicines. Ayurveda is a traditional medical system commonly used in India. The lead concentrations listed here are from medicines manufactured in the United States (based on data from “Lead, Mercury, and Arsenic in US and Indian Manufactured Ayurvedic Medicines Sold via the Internet,” by Saper et al., Journal of the American Medical Association, Vol. 300, No. 8). Use a 0.05 significance level to test the claim that the mean lead concentration for all such medicines is less than 14 μg/g.
3.0 6.5 6.0 5.5 20.5 7.5 12 20.5 11.5 17.5
Problem 22
Testing Hypotheses
In Exercises 13–24, assume that a simple random sample has been selected and test the given claim. Unless specified by your instructor, use either the P-value method or the critical value method for testing hypotheses. Identify the null and alternative hypotheses, test statistic, P-value (or range of P-values), or critical value(s), and state the final conclusion that addresses the original claim.
Got a Minute? Students of the author estimated the length of one minute without reference to a watch or clock, and the times (seconds) are listed below. Use a 0.05 significance level to test the claim that these times are from a population with a mean equal to 60 seconds. Does it appear that students are reasonably good at estimating one minute?
69 81 39 65 42 21 60 63 66 48 64 70 96 91 95
Problem 25
Large Data Sets from Appendix B
In Exercises 25–28, use the data set from Appendix B to test the given claim. Use the P-value method unless your instructor specifies otherwise.
Los Angeles Commute Time Use the 1000 Los Angeles Commute times listed in Data Set 31 “Commute Times” to test the claim that the mean Los Angeles commute time is less than 35 minutes. Use a 0.01 significance level. Compare the sample mean to the claimed mean of 35 minutes. Is the difference between those two values statistically significant? Does the difference between those two values appear to have practical significance?
Problem 29
Large Sample and a Small Difference It has been said that with really large samples, even very small differences between the sample mean and the claimed population mean can appear to be significant, but in reality they are not significant. Test this statement using the claim that the mean IQ score of adults is 100, given the following sample data: n = 1,000,000, x_bar = 100.05, s = 15 . Based on this sample, is the difference between x_bar = 100.05 and the claimed mean of 100 statistically significant? Does that difference have practical significance?
Problem 32a
Hypothesis Test with Known σ
a. How do the results from Example 1 in this section change if σ is known to be 1.99240984 g? Does the knowledge of σ have much of an effect on the results of this hypothesis test?