Textbook Question
What kind of heritability estimates (broad sense or narrow sense) are obtained from human twin studies?
1190
views

 Verified step by step guidance
 08:34
08:34 13:40
13:40 07:04
07:04What kind of heritability estimates (broad sense or narrow sense) are obtained from human twin studies?
List as many human traits as you can that are likely to be under the control of a polygenic mode of inheritance.
Corn plants from a test plot are measured, and the distribution of heights at 10-cm intervals is recorded in the following table:
Height (cm) Plants (no.)
100 20
110 60
120 90
130 130
140 180
150 120
160 70
170 50
180 40
Calculate
(a) the mean height,
(b) the variance,
(c) the standard deviation, and
(d) the standard error of the mean.
Plot a rough graph of plant height against frequency. Do the values represent a normal distribution? Based on your calculations, how would you assess the variation within this population?
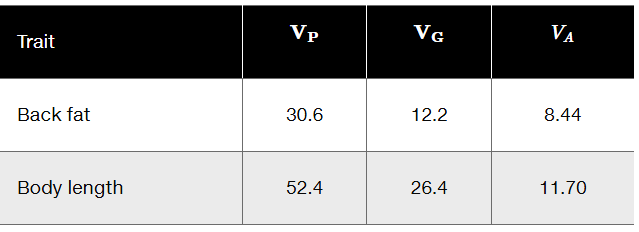
The following variances were calculated for two traits in a herd of hogs.
Which of the two traits will respond best to selection by a breeder? Why?
The mean and variance of plant height of two highly inbred strains (P₁ and P₂) and their progeny (F₁ and F₂) are shown here.
Strain Mean (cm) Variance
P₁ 34.2 4.2
P₂ 55.3 3.8
F₁ 44.2 5.6
F₂ 46.3 10.3
Calculate the broad-sense heritability (H²) of plant height in this species.
A hypothetical study investigated the vitamin A content and the cholesterol content of eggs from a large population of chickens. The following variances (V) were calculated.
Calculate the narrow-sense heritability (h²) for both traits.