Pie Charts (Circle Graphs): Videos & Practice Problems
Pie Charts (Circle Graphs) show how a whole is divided into categories. The full circle graph represents the total amount of data, and each sector or slice represents one category. Larger sectors represent larger parts of the whole, so you can interpret the data by comparing slice sizes to identify the greatest, least, or similar amounts.
To read a pie chart accurately, first connect each sector to its category and value. The total can be found by adding all category values because the circle represents the whole. Some charts show values directly, while others show percentages. When a percentage is not given, convert a category to a percent using \( \frac{\text{partial}}{\text{whole}} \times 100\\% \)
Pie charts can also be used to compare categories, combine parts, and reason about how the distribution changes when one category is removed. Understanding the relationship between each slice and the whole helps you interpret surveys, distributions, and other categorical data clearly.
Circle Graphs


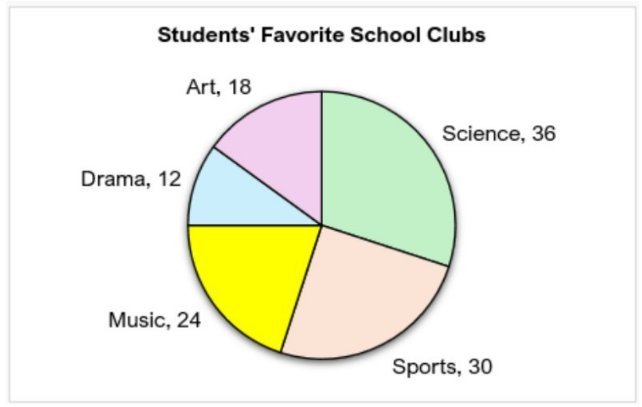
A survey asked 120 students which school club they participate in most often. The results are shown in the following circle graph. Which club has the largest number of students?
Art
Drama
Music
Sports
Science
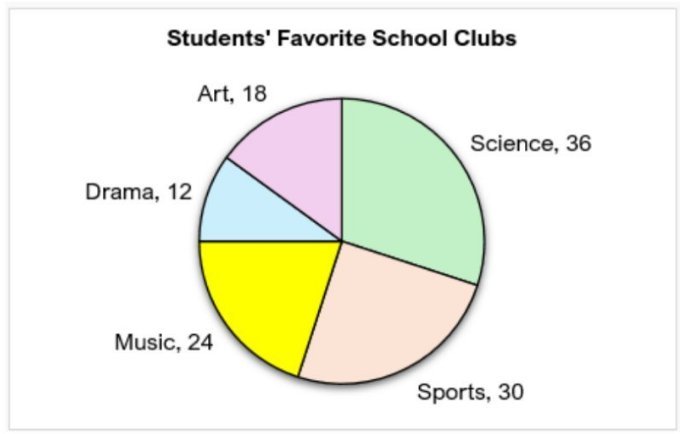
A survey asked 120 students which school club they participate in most often. The results are shown in the following circle graph. Which club has the lowest number of students attending?
Art
Drama
Music
Sports
Science
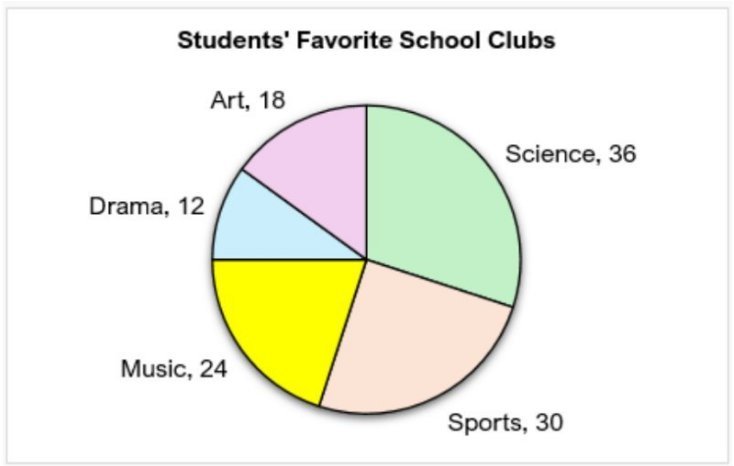
A survey asked 120 students which school club they participate in most often. The results are shown in the following circle graph. How many more students attend Music than Art?
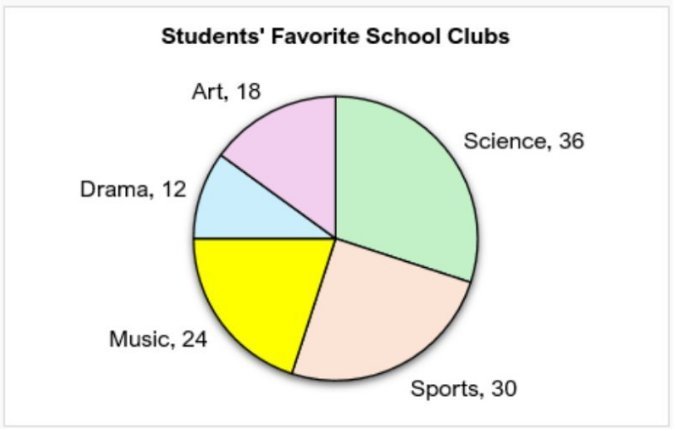
A survey asked 120 students which school club they participate in most often. The results are shown in the following circle graph. What percentage of students are in Sports?
Circle Graphs Example 1
Here's what students ask on this topic:
A pie chart, also known as a circle graph, is a visual tool used to represent data as parts of a whole. The entire circle represents the total quantity of data, and it is divided into sectors or slices, each corresponding to a category within the data. The size of each slice is proportional to the quantity or percentage that category contributes to the whole. This makes it easy to compare different categories visually. For example, if a pie chart shows favorite desserts among students, the largest slice indicates the most popular dessert. Pie charts are useful for showing relative sizes of categories and understanding the distribution of data in a clear, intuitive way.
To find the total number of items represented in a pie chart, you add up the values of all the individual categories shown in the chart. Since the entire circle represents the whole data set, summing all the category values gives you the total. For example, if a pie chart shows the number of students who prefer different desserts, and the slices represent 20, 5, 3, and 2 students respectively, the total number of students is calculated as . This total helps in further calculations like finding percentages or comparing categories.
To convert a category value in a pie chart to a percentage, you use the formula: . Here, the 'Partial' is the value of the category you are interested in, and the 'Whole' is the total value represented by the entire pie chart. For example, if 3 students chose apple pie out of a total of 30 students, the percentage is calculated as . This method is essential when the pie chart does not provide percentages directly.
The size of each slice in a pie chart represents the proportion of that category relative to the whole data set. Larger slices indicate larger parts of the total, while smaller slices represent smaller parts. By comparing slice sizes, you can identify which categories are most or least significant. For example, if the slice for ice cream is the largest in a pie chart showing favorite desserts, it means ice cream is the most popular choice. Understanding this relationship helps in quickly grasping the distribution and relative importance of categories within the data.
If a pie chart does not provide percentage values, you need to calculate them yourself. First, find the total value by adding all category values. Then, for each category, divide its value by the total and multiply by 100 to get the percentage. The formula is: . This conversion allows you to understand the data in terms of percentages, which is often easier to interpret and compare across categories.