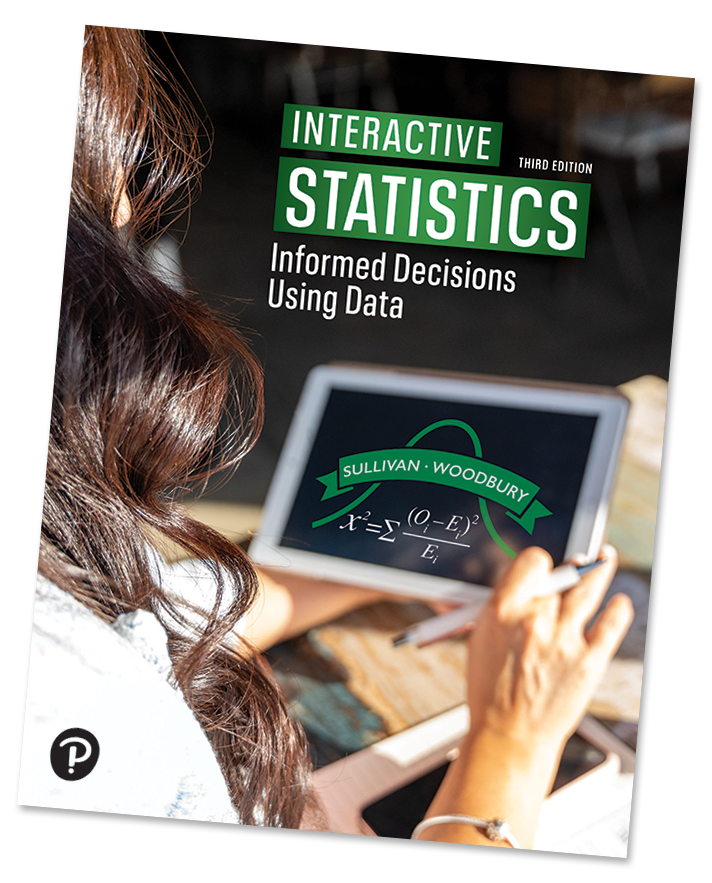
Interactive Statistics, 3e
Michael Sullivan III • George Woodbury
Students learn statistics by seeing and doing statistics
Interactive Statistics: Informed Decisions Using Data, 3rd Edition encourages students to experience statistics in new, dynamic ways as they encounter concepts. Written fully in MyLab® Statistics, it combines text, multimedia and assessment into a seamless, compelling learning experience.
Interactive assignments for each chapter prompt students to “read a little, watch a little, do a little” to develop deeper conceptual connections. This practical approach in an interactive, guided learning environment promotes students’ understanding, retention and the ability to connect statistics to the real world.
Features | Take a tour | Meet the authors | Table of contents | Testimonials | Webinars
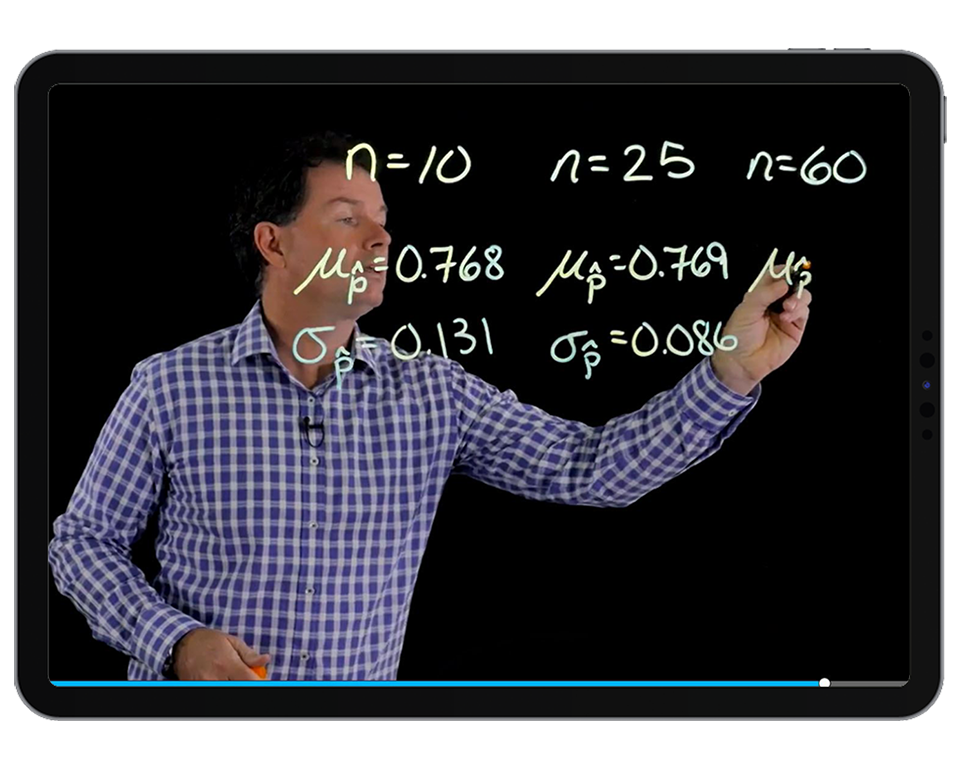
Interactive Assignments
The assignments for each chapter prompt students to “read a little, watch a little, do a little” to develop deeper conceptual connections.
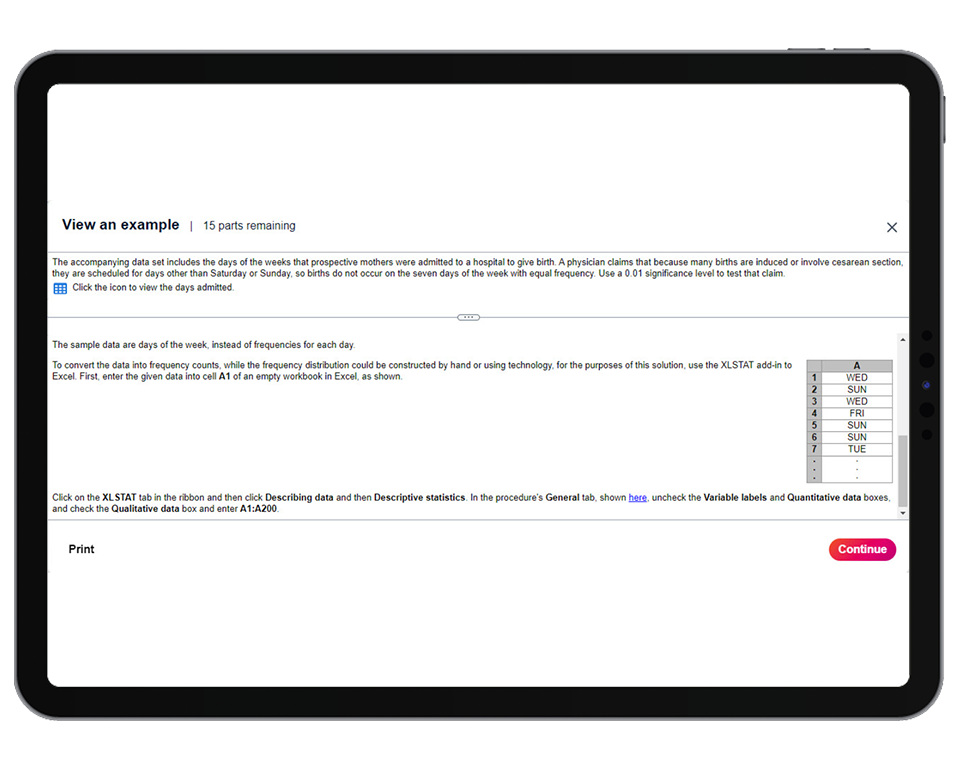
Tech-Specific MyLab Problems
These problems include timely learning aids that provide technology specific help for StatCrunch (-SC), TI-83/84 (-TI), and Excel (-E). In these exercises, students will now see perfectly timed help that includes screenshots and click path support for the analysis technology they’re using.
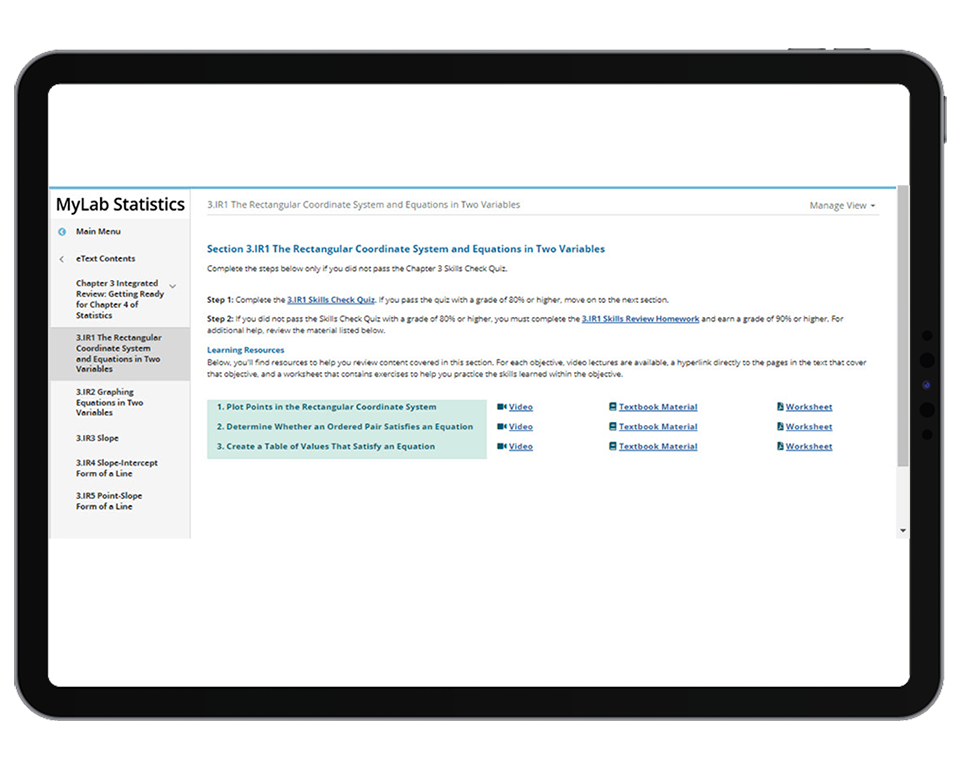
Integrated Review
This content provides additional assignments and engaging study aids from algebra topics for students who will benefit from remediation.
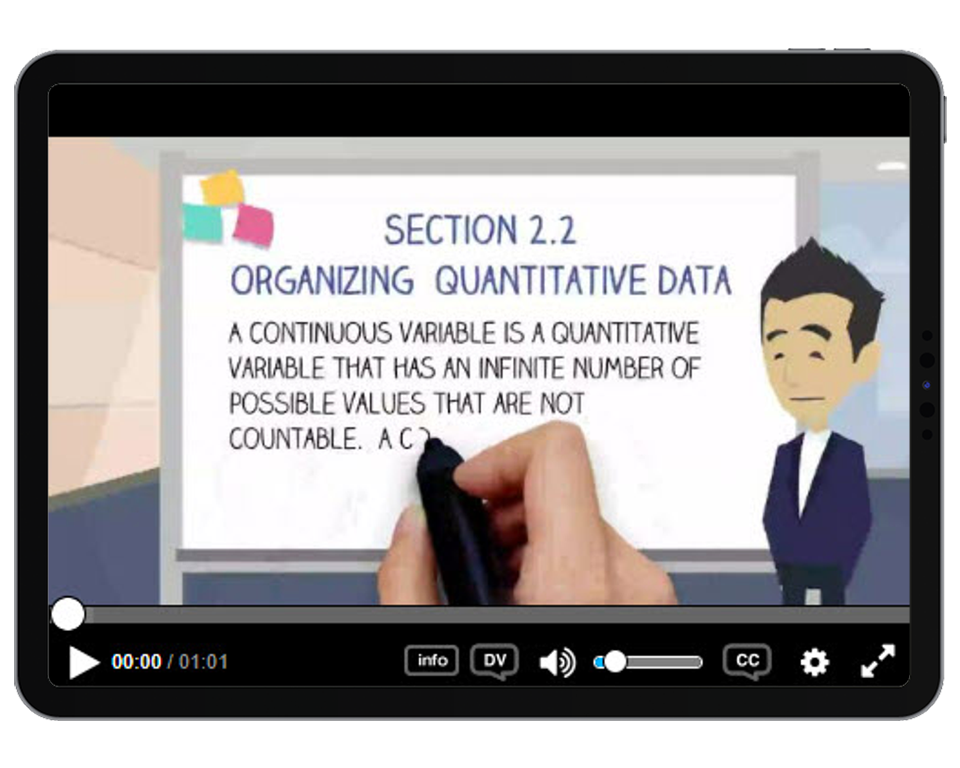
Animations
These open the interactive assignments, giving a brief important context to the content students are about to study.
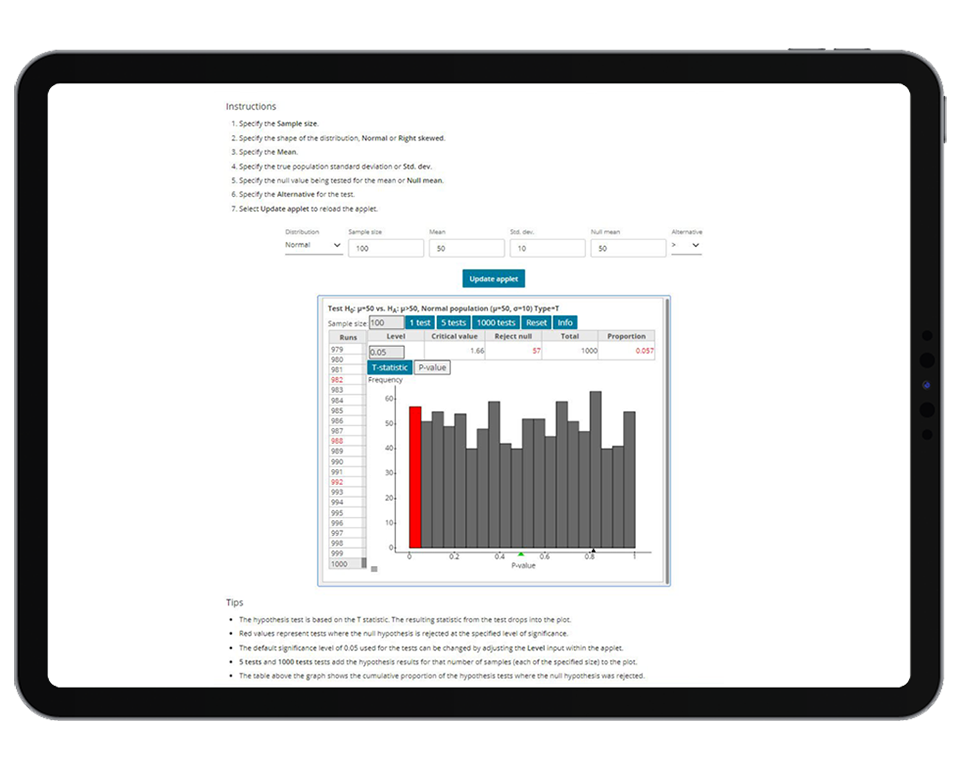
StatCrunch Applet Activities
The activities allow students to easily manipulate data and visualizations to help solve interactive assignments.
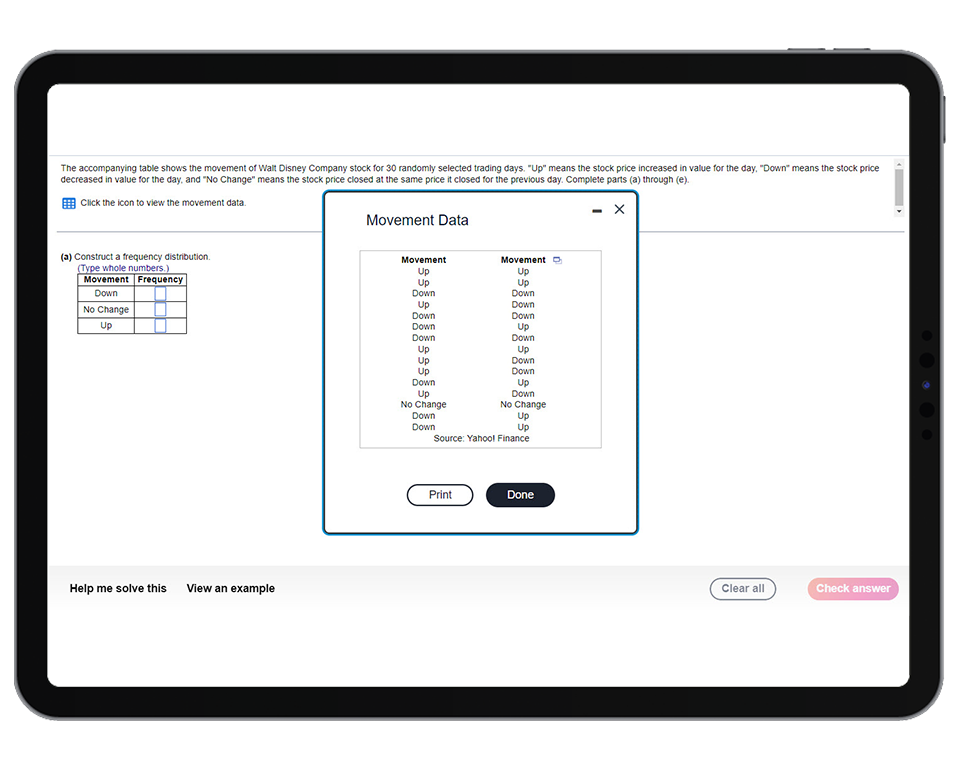
Real Data-based Algorithmic Exercises
MyLab exercises draw upon real data sets to generate unique algorithmic problems, grounded in real-life situations.
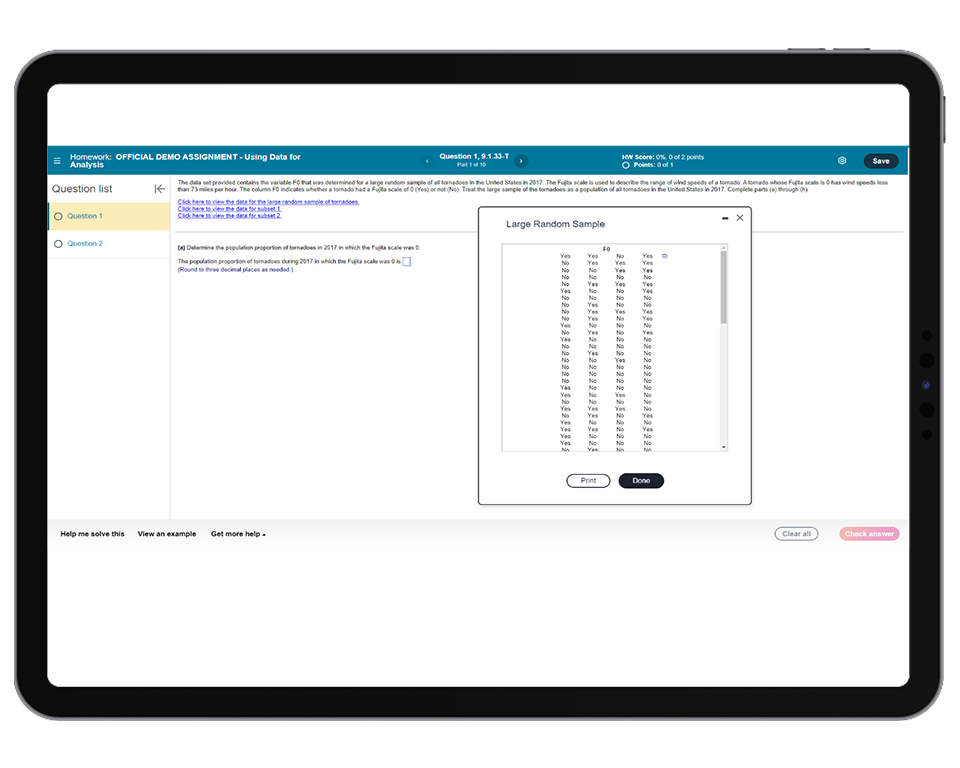
Threaded Tornado Exercises
These exercises, throughout the chapters, rely on a variety of variables stemming from all tornadoes that struck the United States between 1950-2020.
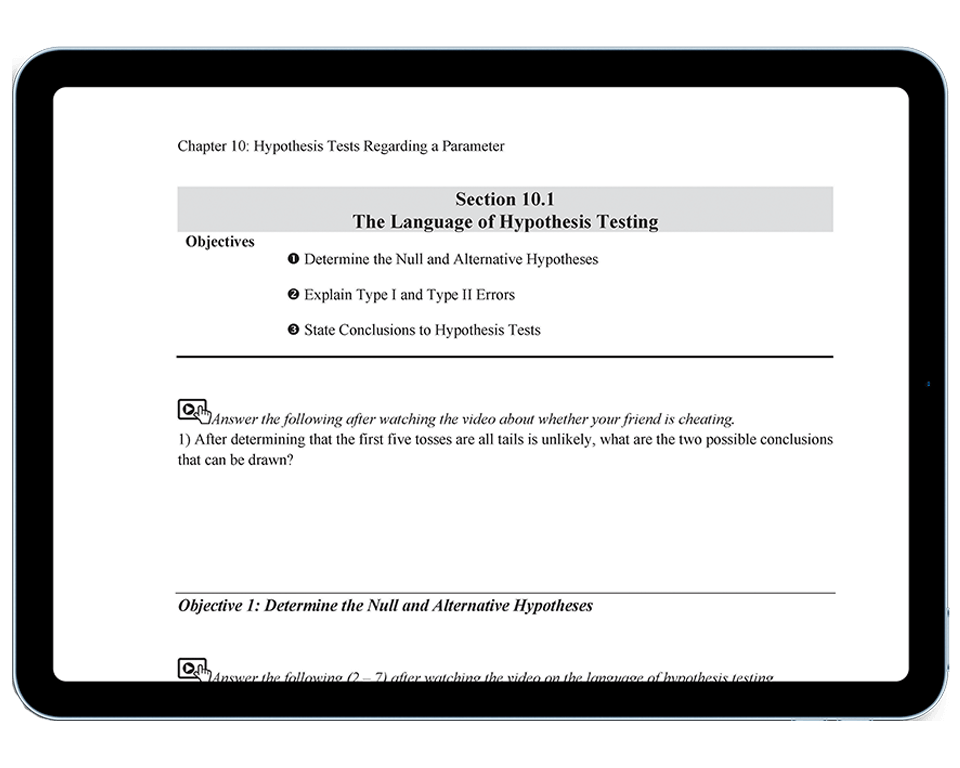
Guided Notebook
This notebook is an ideal companion to interactive assignments, incentivizing students to express their learning in their own words and create study materials for future assessment.
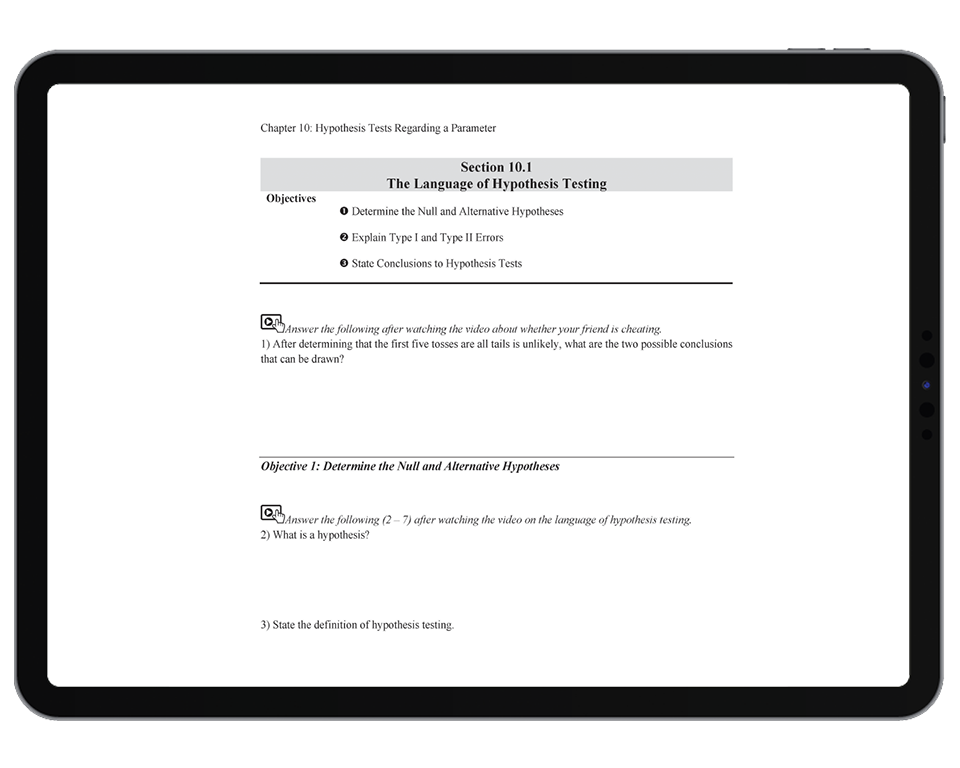
Activity Manual
These activities were designed to improve your student’s study of statistics, encouraging them to be a more active participant.

George Woodbury
College of the Sequoias in Visalia
George Woodbury earned a bachelor’s degree in Mathematics from the University of California–Santa Barbara and a master’s degree in Mathematics from California State University–Northridge. He teaches at College of the Sequoias in Visalia, CA, just outside of Fresno. George has been honored as an instructor by both his students and his colleagues. Aside from teaching and writing, he served as the department chair of the math/engineering division from 1999 through 2004. George has used MyLab Math and Statistics since their inception, continually coming up with creative ways to integrate his teaching with technology. He actively blogs on georgewoodbury.com sharing various thoughts on math, statistics, teaching, and study skills.

Mike Sullivan
Florida SouthWestern State College
Mike Sullivan, III has training in mathematics, statistics, and economics, and brings a varied teaching background that includes 15 years of instruction in both the high school and college-levels. He is a retired full-time professor of mathematics and statistics at Joliet Junior College and current adjunct professor of statistics at Florida SouthWestern State College. Mike publishes series in Developmental Mathematics, Precalculus, and Statistics. Mike provides teaching and learning support at sullystats.com.
1: Data Collection
Section 1.1 Introduction to the Practice of Statistics
Section 1.2 Observational Studies versus Designed Experiments
Section 1.3 Simple Random Sampling
Section 1.4 Other Effective Sampling Methods
Section 1.5 Bias in Sampling
Section 1.6 The Design of Experiments
Chapter 1 Review
Chapter 1 Practice Test
Chapter 1 Projects
2: Organizing and Summarizing Data
Preparing for Section 2.1: Organizing Qualitative Data
Section 2.1 Organizing Qualitative Data
Preparing for Section 2.2: Organizing Quantitative Data: The Popular Displays
Section 2.2 Organizing Quantitative Data: The Popular Displays
Section 2.3 Additional Displays of Quantitative Data
Section 2.4 Graphical Misrepresentations of Data
Chapter 2 Review
Chapter 2 Practice Test
Chapter 2 Projects
3: Numerically Summarizing Data
Preparing for Section 3.1: Measures of Central Tendency
Section 3.1 Measures of Central Tendency
Section 3.2 Measures of Dispersion
Preparing for Section 3.3: Measures of Central Tendency and Dispersion from Grouped Data
Section 3.3 Measures of Central Tendency and Dispersion from Grouped Data
Section 3.4 Measures of Position
Section 3.5 The Five-Number Summary and Boxplots
Chapter 3 Review
Chapter 3 Practice Test
Chapter 3 Projects
4: Describing the Relation between Two Variables
Preparing for Section 4.1: Scatter Diagrams and Correlation
Section 4.1 Scatter Diagrams and Correlation
Preparing for Section 4.2: Least-Squares Regression
Section 4.2 Least-Squares Regression
Preparing for Section 4.3: Diagnostics on the Least-Squares Regression Line
Section 4.3 Diagnostics on the Least-Squares Regression Line
Preparing for Section 4.4: Contingency Tables and Association
Section 4.4 Contingency Tables and Association
Chapter 4 Review
Chapter 4 Practice Test
Chapter 4 Projects
5: Probability
Preparing for Section 5.1: Probability Rules
Section 5.1 Probability Rules
Section 5.2 The Addition Rule and Complements
Section 5.3 Independence and the Multiplication Rule
Section 5.4 Conditional Probability and the General Multiplication Rule
Section 5.5 Counting Techniques
Section 5.6 Simulation
Section 5.7 Putting It Together: Which Method Do I Use?
Chapter 5 Review
Chapter 5 Practice Test
Chapter 5 Projects
6: Discrete Probability Distributions
Preparing for Section 6.1: Discrete Random Variables
Section 6.1 Discrete Random Variables
Preparing for Section 6.2: The Binomial Probability Distribution
Section 6.2 The Binomial Probability Distribution
Section 6.3 The Poisson Probability Distribution
Chapter 6 Review
Chapter 6 Practice Test
Chapter 6 Projects
7: The Normal Probability Distribution
Preparing for Section 7.1: Properties of the Normal Distribution
Section 7.1 Properties of the Normal Distribution
Preparing for Section 7.2: Applications of the Normal Distribution
Section 7.2 Applications of the Normal Distribution
Preparing for Section 7.3: Assessing Normality
Section 7.3 Assessing Normality
Preparing for Section 7.4: The Normal Approximation to the Binomial Probability Distribution
Section 7.4 The Normal Approximation to the Binomial Probability Distribution
Chapter 7 Review
Chapter 7 Practice Test
Chapter 7 Projects
8: Sampling Distributions
Preparing for Section 8.1: Distribution of the Sample Mean
Section 8.1 Distribution of the Sample Mean
Preparing for Section 8.2: Distribution of the Sample Proportion
Section 8.2 Distribution of the Sample Proportion
Chapter 8 Review
Chapter 8 Practice Test
Chapter 8 Projects
9: Estimating the Value of a Parameter
Preparing for Section 9.1: Estimating a Population Proportion
Section 9.1 Estimating a Population Proportion
Preparing for Section 9.2: Estimating a Population Mean
Section 9.2 Estimating a Population Mean
Section 9.3 Putting It Together: Which Procedure Do I Use?
Section 9.4 Estimating with Bootstrapping
Chapter 9 Review
Chapter 9 Practice Test
Chapter 9 Projects
10: Hypothesis Tests Regarding a Parameter
Preparing for Section 10.1: Estimating a Population Mean
Section 10.1 The Language of Hypothesis Testing
Preparing for Section 10.2 Hypothesis Tests for a Population Proportion
Section 10.2 Hypothesis Tests for a Population Proportion
Preparing for Section 10.3 Hypothesis Tests for a Population Mean
Section 10.3 Hypothesis Tests for a Population Mean
Preparing for Section 10.3A Hypothesis Tests on a Population Mean Using Simulation and the Bootstrap
Section 10.3A Hypothesis Tests on a Population Mean Using Simulation and the Bootstrap
Chapter 10 Review
Chapter 10 Practice Test
Chapter 10 Projects
11: Inference on Two Population Parameters
Preparing for Section 11.1: Inference about Two Population Proportions
Section 11.1 Inference about Two Population Proportions: Independent Samples
Section 11.1A Using Randomization Techniques to Compare Two Proportions
Preparing for Section 11.2: Inference about Two Population Means: Dependent Samples
Section 11.2 Inference about Two Population Means: Dependent Samples
Preparing for Section 11.2A: Using Bootstrapping to Conduct Inference on Two Dependent Means
Section 11.2A Using Bootstrapping to Conduct Inference on Two Dependent Means
Preparing for Section 11.3: Inference about Two Population Means: Independent Samples
Section 11.3 Inference about Two Population Means: Independent Samples
Section 11.3A Using Randomization Techniques to Compare Two Independent Means
Section 11.4 Putting It Together: Which Procedure Do I Use?
Chapter 11 Review
Chapter 11 Practice Test
Chapter 11 Projects
12: Inference on Categorical Data
Preparing for Section 12.1: Goodness-of-Fit Test
Section 12.1 Goodness-of-Fit Test
Preparing for Section 12.2: Tests for Independence and the Homogeneity of Proportions
Section 12.2 Tests for Independence and the Homogeneity of Proportions
Preparing for Section 12.3: Inference about Two Population Proportions: Dependent Samples
Section 12.3 Inference about Two Population Proportions: Dependent Samples
Chapter 12 Review
Chapter 12 Practice Test
Chapter 12 Projects
13: Comparing Three or More Means
Preparing for Section 13.1: Comparing Three or More Means: One-Way Analysis of Variance
Section 13.1 Comparing Three or More Means: One-Way Analysis of Variance
Preparing for Section 13.2: Post Hoc Tests on One-Way Analysis of Variance
Section 13.2 Post Hoc Tests on One-Way Analysis of Variance
Chapter 13 Review
Chapter 13 Practice Test
Chapter 13 Projects
14: Inference on the Least-Squares Regression Model and Multiple Regression
Preparing for Section 14.1: Testing the Significance of the Least-Squares Regression Model
Section 14.1 Testing the Significance of the Least-Squares Regression Model
Section 14.1A Using Randomization Techniques on the Slope of the Least-Squares Regression Line
Preparing for Section 14.2: Confidence and Prediction Intervals
Section 14.2 Confidence and Prediction Intervals
Preparing for Section 14.3: Introduction to Multiple Regression
Chapter 14 Review
Chapter 14 Practice Test
Chapter 14 Projects
Appendix
“It has made my online asynchronous courses much better. I can supplement the e-text materials with my videos and the students are very positive about this learning modality. It has also made it much easier to do a flipped classroom in online synchronous and face to face courses.”
—Radford Janssens, University of South Florida
“I would not be able to deliver effective online courses without it. I find it particularly useful with (face-to-face) classes when a student is absent or struggling; there are so many resources I can point them to.”
—Two-Year Community College Instructor
“I do believe it has increased student conceptual knowledge. The students who are very interested in specific topics can use the resources (Like applets) to look more into the topic. The examples and explanations are relative to their lives.”
—Four-Year University Instructor
“Yes, outcomes have improved. Students seem to grasp and retain the detailed content provided in the interactive assignments. This is a much more lively and effective way of providing content, as opposed to old-fashioned textbook reading assignments.”
—Darren Wick, Ashland University