Textbook Question
FIGURE EX2.8 is a somewhat idealized graph of the velocity of blood in the ascending aorta during one beat of the heart. Approximately how far, in cm, does the blood move during one beat?
1870
views

 Verified step by step guidance
 7:27
7:27 05:47
05:47 07:41
07:41FIGURE EX2.8 is a somewhat idealized graph of the velocity of blood in the ascending aorta during one beat of the heart. Approximately how far, in cm, does the blood move during one beat?
FIGURE EX2.8 showed the velocity graph of blood in the aorta. What is the blood's acceleration during each phase of the motion, speeding up and slowing down?
What constant acceleration, in SI units, must a car have to go from zero to 60 mph in 10 s?
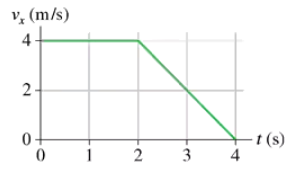
FIGURE EX2.9 shows the velocity graph of a particle. Draw the particle's acceleration graph for the interval 0 s ≤ t ≤ 4 s.
FIGURE EX2.12 shows the velocity-versus-time graph for a particle moving along the x-axis. Its initial position is at x0 = 2 m at t0 = 0 s. What are the particle's position, velocity, and acceleration at t = 3.0 s?
How far has the car traveled when it reaches 60 mph? Give your answer both in SI units and in feet.