Ch. 02 - Describing Motion: Kinematics in One Dimension
Giancoli Douglas - Physics for Scientists and Engineers 5th edition
Giancoli Douglas5th editionPhysics for Scientists and EngineersISBN: 9780137488179Not the one you use?Change textbook
Chapter 2, Problem 102e

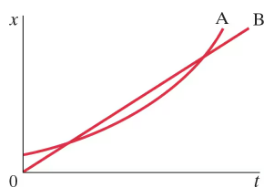
Figure 2–55 shows the position vs. time graph for two bicycles, A and B. Which bicycle has the larger average velocity?
Position vs. time graph showing two bicycles, A and B, with lines indicating their motion over time.

Verified step by step guidance
1
Step 1: Recall the formula for average velocity, which is given by \( v_{\text{avg}} = \frac{\Delta x}{\Delta t} \), where \( \Delta x \) is the change in position and \( \Delta t \) is the change in time.
Step 2: Analyze the position vs. time graph for both bicycles A and B. Identify the initial and final positions (\( x_i \) and \( x_f \)) and the corresponding times (\( t_i \) and \( t_f \)) for each bicycle.
Step 3: Calculate the average velocity for bicycle A using the formula \( v_{\text{avg, A}} = \frac{x_{f, A} - x_{i, A}}{t_{f, A} - t_{i, A}} \). Substitute the values of \( x_{f, A} \), \( x_{i, A} \), \( t_{f, A} \), and \( t_{i, A} \) from the graph.
Step 4: Similarly, calculate the average velocity for bicycle B using the formula \( v_{\text{avg, B}} = \frac{x_{f, B} - x_{i, B}}{t_{f, B} - t_{i, B}} \). Substitute the corresponding values from the graph.
Step 5: Compare the magnitudes of \( v_{\text{avg, A}} \) and \( v_{\text{avg, B}} \). The bicycle with the larger average velocity will have the greater value of \( \frac{\Delta x}{\Delta t} \).

Verified video answer for a similar problem:

This video solution was recommended by our tutors as helpful for the problem above.
Was this helpful?

Key Concepts

Here are the essential concepts you must grasp in order to answer the question correctly.

Average Velocity

Average velocity is defined as the total displacement divided by the total time taken. It is a vector quantity, meaning it has both magnitude and direction. In the context of a position vs. time graph, the average velocity can be determined by calculating the slope of the line connecting the initial and final positions of an object over a given time interval.
Recommended video:
Guided course
05:44
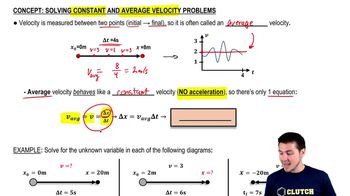
Solving Constant and Average Velocity Problems

Position vs. Time Graph

A position vs. time graph visually represents an object's position as a function of time. The x-axis typically represents time, while the y-axis represents position. The slope of the graph at any point indicates the object's instantaneous velocity, while the overall slope between two points gives the average velocity over that time interval.
Recommended video:
Guided course
03:04
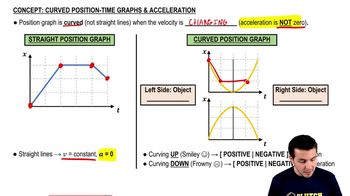
Curved Position-Time Graphs & Acceleration

Comparing Velocities

To determine which bicycle has the larger average velocity, one must compare the slopes of their respective position vs. time graphs. A steeper slope indicates a greater average velocity. By analyzing the graph, one can identify which bicycle covers more distance in the same amount of time, thus revealing which has the larger average velocity.
Recommended video:
Guided course
03:14
Comparing Buoyant Forces