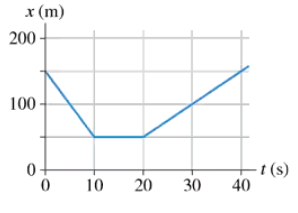
Larry leaves home at 9:05 and runs at constant speed to the lamppost seen in FIGURE EX2.1. He reaches the lamppost at 9:07, immediately turns, and runs to the tree. Larry arrives at the tree at 9:10. What is Larry's average velocity for the entire run?
FIGURE EX2.4 is the position-versus-time graph of a bicycle. What is the bicycle's velocity at t = 30s?

Verified step by step guidance
Verified video answer for a similar problem:
Key Concepts
Position vs. Time Graph
Velocity
Calculating Slope
Julie drives 100 mi to Grandmother's house. On the way to Grandmother's, Julie drives half the distance at 40 mph and half the distance at 60 mph. On her return trip, she drives half the time at 40 mph and half the time at 60 mph. What is Julie's average speed on the way to Grandmother's house?
FIGURE EX2.4 is the position-versus-time graph of a bicycle. What is the bicycle's velocity at t = 5s
FIGURE EX2.5 shows the position graph of a particle. Draw the particle’s velocity graph for the interval .
A particle starts from at and moves with the velocity graph shown in FIGURE EX2.6. Does this particle have a turning point? If so, at what time?
A particle starts from x0 = 10 m at t0 = 0 s and moves with the velocity graph shown in FIGURE EX2.6. What is the object’s position at t = 2 s and 4 s?
