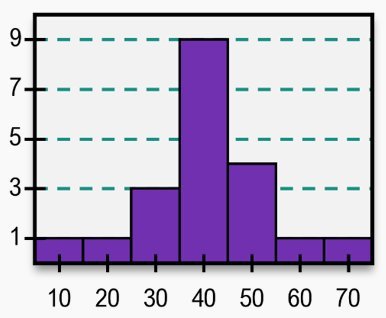
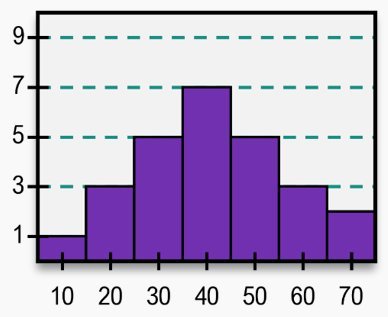
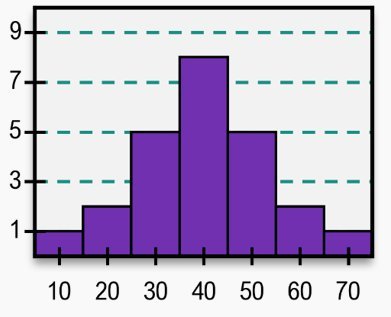
Label each distribution as normal, skewed left, skewed right, or other.
Table of contents
- 1. Critical Thinking & Problem Solving1h 59m
- 2. Sets4h 25m
- 3. Logic4h 33m
- 4. The Real Number System3h 5m
- 5. Algebra Review8h 46m
- Evaluating Algebraic Expressions15m
- Simplifying Algebraic Expressions1h 2m
- Linear Equations41m
- Direct & Inverse Variation27m
- Linear Inequalities in One Variable41m
- Quadratic Equations59m
- Rectangular Coordinate System28m
- Intro to Functions and Notation29m
- Domain and Range10m
- Using Intercepts to Graph Lines4m
- Slope and Slope-Intercept Form58m
- Systems of Linear Equations1h 25m
- Systems of Linear Inequalities37m
- The Quadratic Formula24m
- 6. Exponential Growth41m
- 7. Personal Finance4h 28m
- 8. Measurement & the Metric System1h 49m
- 9. Geometry3h 37m
- 10. Voting and Apportionment3h 3m
- 11. Graph Theory3h 1m
- 12. Counting & Probability1h 55m
- 13. Introductory Statistics4h 34m
- Introduction to Statistics12m
- Simple Random Sampling10m
- Sampling Methods12m
- Intro to Collecting Data8m
- Types of Data9m
- Bar Graphs22m
- Frequency Distributions and Histograms50m
- Pie Charts (Circle Graphs)14m
- Frequency Polygons10m
- Stemplots14m
- Time Series Graphs9m
- Measures of Central Tendency34m
- Percentiles and Quartiles14m
- Boxplots8m
- Boxplots - Excel8m
- Standard Deviation16m
- Describing Data Numerically Using a Graphing Calculator4m
- Descriptive Statistics - Excel11m
- 14. Predictive Statistics: The Normal Curve and Regression4h 12m
- Intro to Normal Distributions22m
- Interpreting Standard Deviation20m
- Finding Percents of Data for The Normal Distribution1h 3m
- Probabilities & Z-Scores w/ Graphing Calculator19m
- Finding Probabilities, Z Values, and X Values with the Normal Distribution-Excel32m
- Scatterplots & Intro to Correlation26m
- Correlation Coefficient21m
- Creating Scatterplots and Finding Correlation Coefficient - Excel6m
- Linear Regression37m
14. Predictive Statistics: The Normal Curve and Regression
Intro to Normal Distributions
Multiple Choice
The three histograms show the finishing times (in minutes) for the same 5K race run by three different age groups. Which distribution has the highest standard deviation?
A
B
C
0 Comments
Related Videos
Related Practice
Multiple Choice