Table of contents
- 1. Critical Thinking & Problem Solving1h 59m
- 2. Sets4h 25m
- 3. Logic4h 33m
- 4. The Real Number System3h 5m
- 5. Algebra Review8h 46m
- Evaluating Algebraic Expressions15m
- Simplifying Algebraic Expressions1h 2m
- Linear Equations41m
- Direct & Inverse Variation27m
- Linear Inequalities in One Variable41m
- Quadratic Equations59m
- Rectangular Coordinate System28m
- Intro to Functions and Notation29m
- Domain and Range10m
- Using Intercepts to Graph Lines4m
- Slope and Slope-Intercept Form58m
- Systems of Linear Equations1h 25m
- Systems of Linear Inequalities37m
- The Quadratic Formula24m
- 6. Exponential Growth41m
- 7. Personal Finance4h 28m
- 8. Measurement & the Metric System1h 49m
- 9. Geometry3h 37m
- 10. Voting and Apportionment3h 3m
- 11. Graph Theory3h 1m
- 12. Counting & Probability1h 55m
- 13. Introductory Statistics4h 34m
- Introduction to Statistics12m
- Simple Random Sampling10m
- Sampling Methods12m
- Intro to Collecting Data8m
- Types of Data9m
- Bar Graphs22m
- Frequency Distributions and Histograms50m
- Pie Charts (Circle Graphs)14m
- Frequency Polygons10m
- Stemplots14m
- Time Series Graphs9m
- Measures of Central Tendency34m
- Percentiles and Quartiles14m
- Boxplots8m
- Boxplots - Excel8m
- Standard Deviation16m
- Describing Data Numerically Using a Graphing Calculator4m
- Descriptive Statistics - Excel11m
- 14. Predictive Statistics: The Normal Curve and Regression4h 12m
- Intro to Normal Distributions22m
- Interpreting Standard Deviation20m
- Finding Percents of Data for The Normal Distribution1h 3m
- Probabilities & Z-Scores w/ Graphing Calculator19m
- Finding Probabilities, Z Values, and X Values with the Normal Distribution-Excel32m
- Scatterplots & Intro to Correlation26m
- Correlation Coefficient21m
- Creating Scatterplots and Finding Correlation Coefficient - Excel6m
- Linear Regression37m
13. Introductory Statistics
Descriptive Statistics - Excel



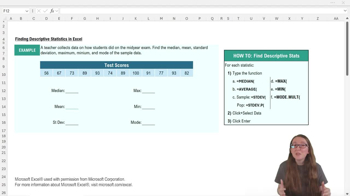
Descriptive Statistics-Excel Example 1
Colleen Daly

Video duration:
5mPlay a video:
Related Videos
 06:10
