Power Maths assessment: How do your results compare with our 'all schools averages'?

As you may already know, all Power Maths users have access to the Markbook within the online materials (just click the Markbook tile when you log in). This allows you to enter scores from the Power Maths Progress Tests and analyse results against age-related expectations.

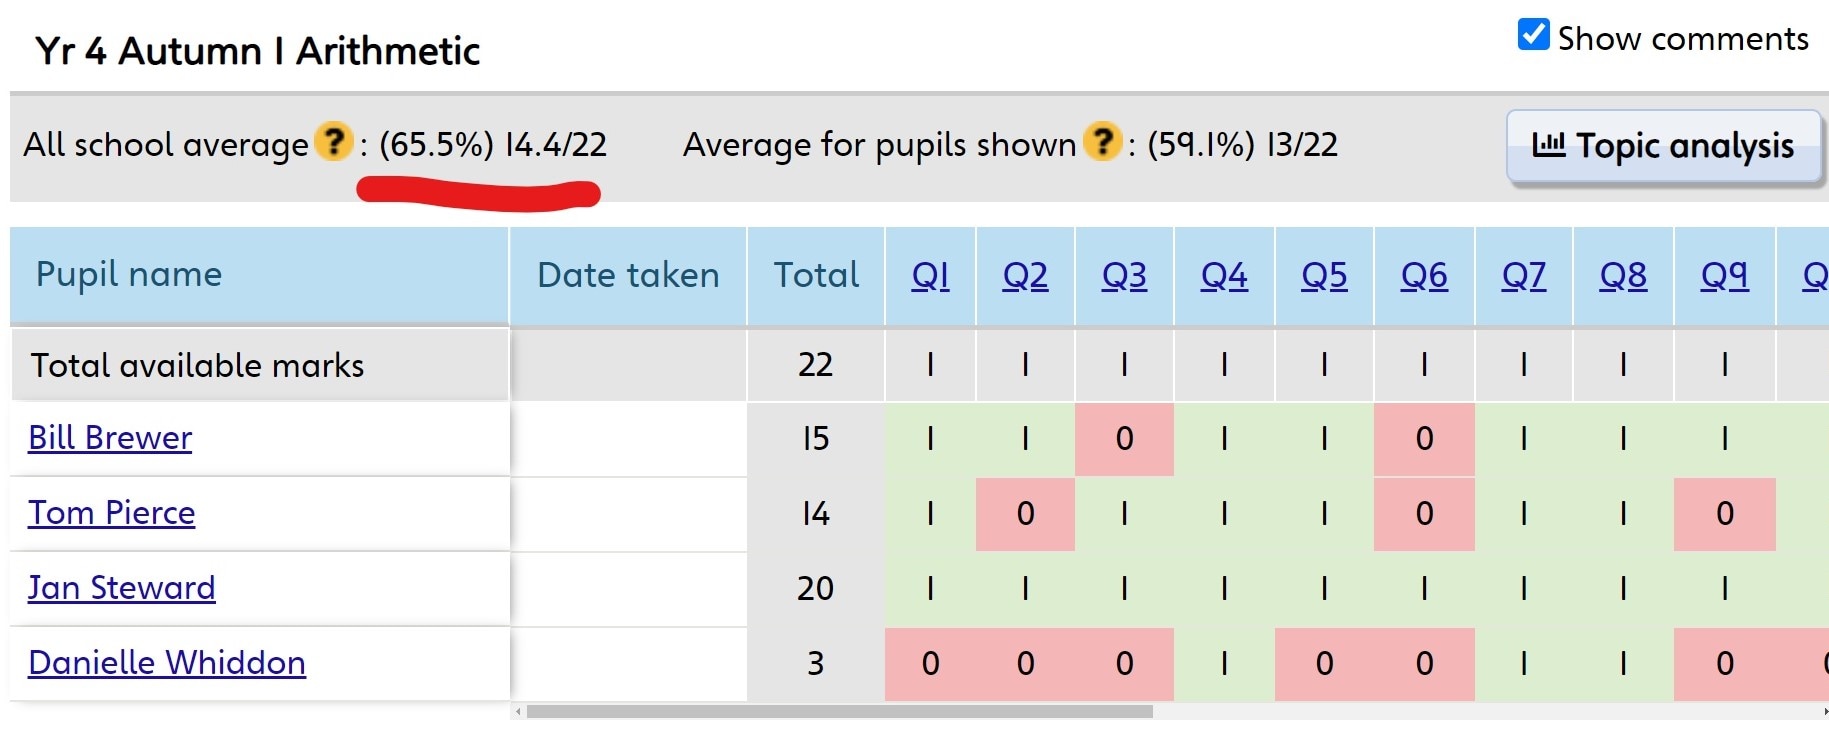
It also allows you to compare your results with other schools. For each test there is an ‘All school average’ (highlighted below). This only appears once enough schools have input data for that test. You can now see these averages on the platform for the Autumn 1 tests for each year group (these cover the first half of the autumn term).

Average scores for Autumn 1
There is an Arithmetic and a Reasoning test to assess the work from each half term in the Power Maths progression. Tables 1a and 1b show the average scores now visible in Active Learn. The last row shows how the average score relates to age-related expectation on our six-step scale. Note that when you look at the Overview tab for your class in the Markbook, children’s scores are shown against this scale, i.e. Below, Towards, Expected, Secure, Towards Greater Depth, Greater Depth.
Table 1a: All school averages for Autumn 1 tests (KS1)
|
||||
|---|---|---|---|---|
| Year 1 | Year 1 | Year 2 | Year 2 | |
| Arithmetic / Reasoning | A | R | A | R |
| Total Marks | 10 | 10 | 14 | 14 |
| Average Score | 6.0 | 5.7 | 8.3 | 8.8 |
| Average Score % | 60.2% | 57.0% | 59.1% | 63.0% |
| ARE Scale | E | E/S | E | E/S |
Table 1b: All school averages for Autumn 1 tests (KS2)
|
||||||||
|---|---|---|---|---|---|---|---|---|
| Year 3 | Year 3 | Year 4 | Year 4 | Year 5 | Year 5 | Year 6 | Year 6 | |
| Arithmetic/ Reasoning | A | R | A | R | A | R | A | R |
| Total Marks | 18 | 18 | 22 | 22 | 26 | 26 | 30 | 30 |
| Average Score | 10.7 | 8.3 | 14.4 | 15.1 | 15.9 | 13.5 | 16.2 | 15.9 |
| Average Score % | 59.2% | 45.9% | 65.4% | 68.5% | 61.1% | 53.9% | 54.1% | 52.9% |
| ARE Scale | E | E | E/S | E | E | E | E | E |
Almost all the average scores are in the Expected band of the scale. E/S indicates the average is on the borderline, e.g. an average score of 14.4 where 14 would be Expected and 15 would be Secure. It’s natural that the average percentage varies more than the position on the scale: there are inevitable differences in difficulty between tests, whereas the boundaries of the six-step scale for each test have been determined through consultation with independent teams of teachers and assessment experts.
Most schools entering data in 2019 would be quite new to Power Maths, and clearly all schools have faced major challenges in 2020, so perhaps we will see these averages rise over time. Looking at the differences between 2019 and 2020 scores (not shown in the tables), there is a slight rise for all the Y1-5 tests and a slight drop in Y6. These differences are sufficiently small that they don’t affect the position of the average on the 6-step scale (with one exception: based on 2019 scores the average for Year 4 Autumn 1 Arithmetic would be Expected rather than Expected/Secure).
Hopefully it’s useful to have this comparison and in many cases reassuring!
Average scores for Autumn 2
You won’t see the average scores for the Autumn 2 tests yet on Active Learn, but hopefully these will appear early next term once enough schools have entered this year’s data. You might be interested to know about scores from last year, shown in Tables 2a and 2b, although bear in mind this is from a smaller data set (11,566 scores across the various tests). As with the Autumn 1 results, most of the average scores are in the Expected band, although the average for Year 1 Arithmetic is Secure.
Table 2a: All school averages for Autumn 2 tests (KS1)limited data from 2019
|
||||
|---|---|---|---|---|
| Year 1 | Year 1 | Year 2 | Year 2 | |
| Arithmetic / Reasoning | A | R | A | R |
| Total Marks | 10 | 10 | 14 | 14 |
| Average Score | 7.3 | 5.8 | 7.9 | 6.8 |
| Average Score % | 73.3% | 58.4% | 56.4% | 48.4% |
| ARE Scale | S | E | E | E |
Table 2b: All school averages for Autumn 2 tests (KS2)limited data from 2019
|
||||||||
|---|---|---|---|---|---|---|---|---|
| Year 3 | Year 3 | Year 4 | Year 4 | Year 5 | Year 5 | Year 6 | Year 6 | |
| Arithmetic/ Reasoning | A | R | A | R | A | R | A | R |
| Total Marks | 18 | 18 | 22 | 22 | 26 | 26 | 30 | 30 |
| Average Score | 11.0 | 11.7 | 12.5 | 12.9 | 14.5 | 12.1 | 15.8 | 14.3 |
| Average Score % | 60.9% | 65.1% | 56.9% | 58.5% | 55.7% | 46.5% | 52.6% | 47.6% |
| ARE Scale | E | E/S | E | E | E | E | E | E |
Don’t forget to enter your scores and play your part in building up the data set for everyone!
Find out more about Power Maths Progress Tests and then head to the Try page to see samples.