Ch 02: Kinematics in One Dimension
Knight Calc - Physics for Scientists and Engineers 5th Edition
Knight Calc5th EditionPhysics for Scientists and EngineersISBN: 9780137344796Not the one you use?Change textbook
Chapter 2, Problem 32

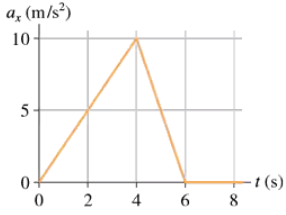
FIGURE EX2.32 shows the acceleration graph for a particle that starts from rest at t = 0 s. What is the particle's velocity at t = 6 s?

Verified step by step guidance
1
Step 1: Understand the relationship between acceleration and velocity. Velocity is the integral of acceleration with respect to time. Since the particle starts from rest, the initial velocity at t = 0 s is 0 m/s.
Step 2: Analyze the graph provided. The acceleration graph is a straight line from t = 0 s to t = 20 s, with acceleration increasing linearly from 0 m/s² to 12 m/s². For t = 6 s, focus on the triangular region from t = 0 s to t = 6 s.
Step 3: Calculate the area under the acceleration graph from t = 0 s to t = 6 s. The area under the graph represents the change in velocity. The graph forms a triangle in this interval, so use the formula for the area of a triangle: \( \text{Area} = \frac{1}{2} \times \text{base} \times \text{height} \). Here, the base is 6 s and the height is the acceleration at t = 6 s, which can be determined from the graph.
Step 4: Determine the acceleration at t = 6 s using the slope of the graph. The slope is \( \frac{12 \text{ m/s}^2}{20 \text{ s}} \), so the acceleration at t = 6 s is \( \text{slope} \times 6 \text{ s} \). Substitute this value into the area formula to find the change in velocity.
Step 5: Add the change in velocity to the initial velocity (which is 0 m/s) to find the particle's velocity at t = 6 s. This will give the final velocity at t = 6 s.

Verified video answer for a similar problem:

This video solution was recommended by our tutors as helpful for the problem above.
Video duration:
4m
Was this helpful?

Key Concepts

Here are the essential concepts you must grasp in order to answer the question correctly.

Acceleration

Acceleration is the rate of change of velocity of an object with respect to time. It is a vector quantity, meaning it has both magnitude and direction. In the context of the provided graph, the area under the acceleration curve represents the change in velocity over time, which is crucial for determining the particle's velocity at any given moment.
Recommended video:
Guided course
05:47
Intro to Acceleration

Velocity from Acceleration

To find the velocity of a particle from its acceleration graph, one must calculate the area under the acceleration curve over the desired time interval. This area represents the total change in velocity. Since the particle starts from rest, the initial velocity is zero, and the final velocity can be found by summing the areas under the curve from t = 0 s to t = 6 s.
Recommended video:
Guided course
05:33
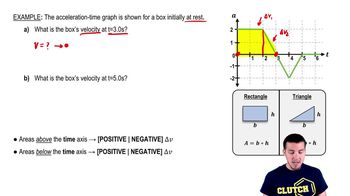
Calculating Change in Velocity from Acceleration-Time Graphs

Integration of Acceleration

Integration is a mathematical process used to find the area under a curve, which in physics often corresponds to finding quantities like displacement or velocity. In this case, integrating the acceleration function over time gives the change in velocity. Understanding how to perform this integration is essential for solving the problem and determining the particle's velocity at t = 6 s.
Recommended video:
Guided course
11:43
Finding Moment Of Inertia By Integrating