
Ch 39: Wave Functions and Uncertainty
Knight Calc - Physics for Scientists and Engineers 5th Edition
Knight Calc5th EditionPhysics for Scientists and EngineersISBN: 9780137344796Not the one you use?Change textbook
Chapter 39, Problem 29b

Consider a single-slit diffraction experiment using electrons. (Single-slit diffraction was described in Section 33.4.) Using Figure 39.5 as a model, draw A graph of |ψ(x)|2 for the electrons on the detection screen.

Verified step by step guidance
1
Understand the context: Single-slit diffraction occurs when a wave (in this case, the wave-like behavior of electrons) passes through a narrow slit, causing the wave to spread out and interfere with itself. The intensity pattern on the detection screen is proportional to the square of the wavefunction, |ψ(x)|².
Recall the mathematical description: The intensity pattern for single-slit diffraction is given by the formula: I(x) ∝ (sin(β)/β)², where β = (πa sin(θ))/λ. Here, 'a' is the slit width, 'λ' is the wavelength of the electrons, and 'θ' is the angle relative to the central axis.
Relate the wavefunction to intensity: The wavefunction ψ(x) describes the probability amplitude of finding an electron at a position x on the detection screen. The intensity |ψ(x)|² is proportional to the probability of detecting an electron at that position. The central maximum corresponds to the highest intensity, and the intensity decreases for subsequent maxima and minima.
Sketch the graph: The graph of |ψ(x)|² will have a central peak (the central maximum) at x = 0, with smaller secondary peaks (side maxima) on either side. The intensity of these side maxima decreases as you move further from the center, and there are points of zero intensity (minima) between the peaks.
Label the graph: On the x-axis, label the position x on the detection screen. On the y-axis, label the intensity |ψ(x)|². Indicate the central maximum at x = 0, and show the decreasing intensity of the side maxima as well as the positions of the minima where the intensity is zero.

Verified video answer for a similar problem:

This video solution was recommended by our tutors as helpful for the problem above.
Was this helpful?

Key Concepts

Here are the essential concepts you must grasp in order to answer the question correctly.

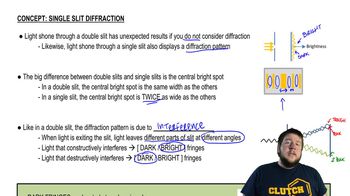
Single-Slit Diffraction

Single-slit diffraction refers to the phenomenon where waves, such as light or electrons, pass through a narrow slit and spread out, creating an interference pattern on a screen. This occurs because different parts of the wavefront passing through the slit can interfere with each other, leading to regions of constructive and destructive interference. The resulting pattern typically consists of a central bright fringe and several dimmer fringes on either side.
Recommended video:
Guided course
12:33
Single Slit Diffraciton

Wave Function (ψ)

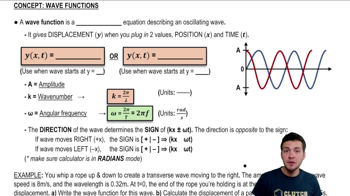
In quantum mechanics, the wave function (ψ) describes the quantum state of a particle, such as an electron. The square of the absolute value of the wave function, |ψ(x)|², represents the probability density of finding the particle at a particular position x. This concept is crucial for understanding how particles exhibit wave-like behavior, particularly in phenomena like diffraction.
Recommended video:
Guided course
08:30
Intro to Wave Functions

Interference Pattern

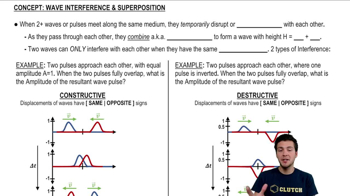
An interference pattern is the result of the superposition of two or more wave functions, leading to regions of varying intensity on a detection screen. In the context of single-slit diffraction, the interference pattern arises from the coherent addition of wavelets emanating from different points within the slit. The pattern typically shows a central maximum with decreasing intensity in the side fringes, illustrating the wave nature of particles like electrons.
Recommended video:
Guided course
03:47
Wave Interference & Superposition
Related Practice
Textbook Question

FIGURE P39.28 shows a pulse train. The period of the pulse train is T = 2 Δt, where Δt is the duration of each pulse. What is the maximum pulse-transmission rate (pulses per second) through an electronics system with a 200 kHz bandwidth? (This is the bandwidth allotted to each FM radio station.)

82
views
Textbook Question

A 1.0-mm-diameter sphere bounces back and forth between two walls at x = 0 mm and x = 100 mm. The collisions are perfectly elastic, and the sphere repeats this motion over and over with no loss of speed. At a random instant of time, what is the probability that the center of the sphere is between x = 49.0 mm and x = 51.0 mm?

44
views
Textbook Question

FIGURE P39.31 shows the wave function of a particle confined between x = 0 nm and x = 1.0 nm. The wave function is zero outside this region. Determine the value of the constant c, as defined in the figure.

328
views
Textbook Question

An experiment finds electrons to be uniformly distributed over the interval 0 cm ≤ x ≤ 2 cm, with no electrons falling outside this interval. If 106 electrons are detected, how many will be detected in the interval 0.79 to 0.81 cm?

60
views
Textbook Question

A 1.0-mm-diameter sphere bounces back and forth between two walls at x = 0 mm and x = 100 mm. The collisions are perfectly elastic, and the sphere repeats this motion over and over with no loss of speed. At a random instant of time, what is the probability that the center of the sphere is at exactly x = 50.0 mm?

63
views
Textbook Question

An experiment finds electrons to be uniformly distributed over the interval 0 cm ≤ x ≤ 2 cm, with no electrons falling outside this interval. What is the probability density at x = 0.80 cm?

68
views