Join thousands of students who trust us to help them ace their exams!
Multiple Choice
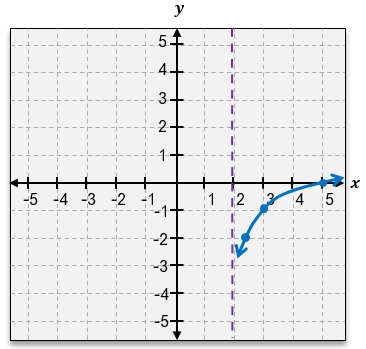
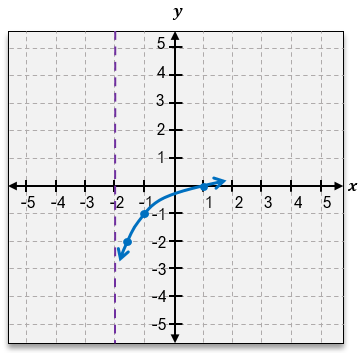
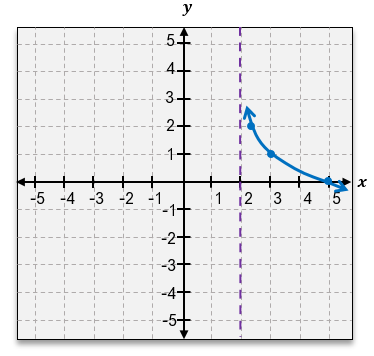
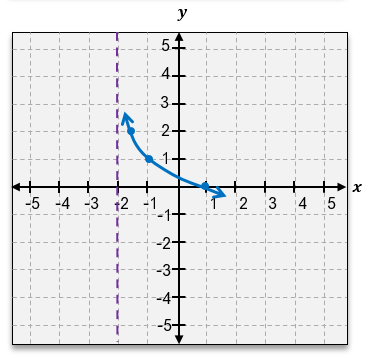
Graph the given function.
A
B
C
D
1 Comment
Verified step by step guidance
1
Identify the base function: The given function is g(x) = \(\log\)_2(x-1) - 4. The base function is \(\log\)_2(x), which is a logarithmic function with base 2.
Determine the transformations: The function \(\log\)_2(x-1) represents a horizontal shift to the right by 1 unit. The '-4' at the end of the function indicates a vertical shift downward by 4 units.
Find the vertical asymptote: For the function \(\log\)_2(x-1), the vertical asymptote is at x = 1, because the logarithm is undefined for x ≤ 1.
Plot key points: Choose values of x greater than 1 to find corresponding y-values. For example, if x = 2, g(x) = \(\log\)_2(2-1) - 4 = \(\log\)_2(1) - 4 = 0 - 4 = -4. Plot this point and a few others to get the shape of the graph.
Sketch the graph: Draw the curve starting from just above the x-axis at x = 1, moving to the right, and approaching the vertical asymptote at x = 1. The graph should be decreasing and shifted downwards by 4 units.


 Verified step by step guidance
