Textbook Question
In problems 5.51 to 5.54, a nucleus is shown with protons and neutrons.
Draw the nucleus that emits a beta particle to complete the following:
<IMAGE>
1167
views
 Verified step by step guidance
 02:52
02:52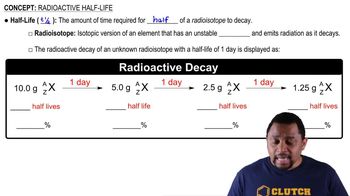 02:09
02:09 05:54
05:54In problems 5.51 to 5.54, a nucleus is shown with protons and neutrons.
Draw the nucleus that emits a beta particle to complete the following:
<IMAGE>
In problems 5.51 to 5.54, a nucleus is shown with protons and neutrons.
Draw the nucleus of the isotope that is bombarded in the following:
<IMAGE>
In problems 5.51 to 5.54, a nucleus is shown with protons and neutrons.
Complete the following bombardment reaction by drawing the nucleus of the new isotope that is produced in the following:
<IMAGE>
Identify each of the following as alpha decay, beta decay, positron emission, or gamma emission:
a. 27m13Al → 2713Al + 00γ
Identify each of the following as alpha decay, beta decay, positron emission, or gamma emission:
a. 12755Cs → 12754Xe + 0+1e
Identify each of the following as alpha decay, beta decay, positron emission, or gamma emission:
b. 9038Sr → 9039Y + 0–1e