Ch 18: A Macroscopic Description of Matter
Knight Calc - Physics for Scientists and Engineers 5th Edition
Knight Calc5th EditionPhysics for Scientists and EngineersISBN: 9780137344796Not the one you use?Change textbook
Chapter 18, Problem 59b

In Problems 67,68,69,67, 68, 69, and 7070 you are given the equation(s) used to solve a problem. For each of these, you are to draw a pV diagram.
(T2+273) K=200 kPa500 kPa×1×(400+273) K(T_2 + 273) \(\text{ K}\) = \(\frac{200 \text{ kPa}\)}{500 \(\text{ kPa}\)} \(\times\) 1 \(\times\) (400 + 273) \(\text{ K}\)

Verified step by step guidance
1
Step 1: Understand the given equation. The equation provided is used to calculate the final volume (V₂) of a gas using the relationship between temperature and volume, which is derived from Charles's Law: \( \frac{V_1}{T_1} = \frac{V_2}{T_2} \). This law states that for a fixed amount of gas at constant pressure, the volume is directly proportional to its temperature in Kelvin.
Step 2: Convert the temperatures from Celsius to Kelvin. The temperatures \( T_1 \) and \( T_2 \) are given as 50°C and 400°C, respectively. To convert to Kelvin, use the formula \( T(K) = T(°C) + 273 \). Substitute the values to find \( T_1 \) and \( T_2 \).
Step 3: Substitute the known values into the equation. The initial volume \( V_1 \) is given as 200 cm³, and the temperatures \( T_1 \) and \( T_2 \) are now in Kelvin. Plug these values into the equation \( V_2 = \frac{T_2}{T_1} \times V_1 \).
Step 4: Simplify the equation to find \( V_2 \). Perform the division \( \frac{T_2}{T_1} \) and multiply the result by \( V_1 \). This will give the final volume \( V_2 \).
Step 5: Draw the pV diagram. A pV diagram plots pressure (p) versus volume (V). Since the problem involves a change in volume due to temperature at constant pressure, the graph will show a linear relationship between volume and temperature. Label the initial and final volumes \( V_1 \) and \( V_2 \) on the x-axis, and ensure the pressure remains constant along the y-axis.

Verified video answer for a similar problem:

This video solution was recommended by our tutors as helpful for the problem above.
Video duration:
7m
Was this helpful?

Key Concepts

Here are the essential concepts you must grasp in order to answer the question correctly.

pV Diagram

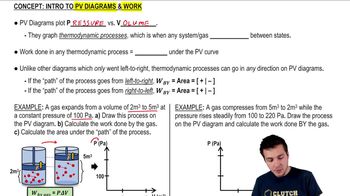
A pV diagram, or pressure-volume diagram, is a graphical representation of the relationship between the pressure (p) and volume (V) of a gas during a thermodynamic process. It helps visualize how the state of a gas changes under different conditions, such as isothermal or adiabatic processes. The area under the curve in a pV diagram represents the work done by or on the gas.
Recommended video:
Guided course
08:07
Work and PV Diagrams

Ideal Gas Law

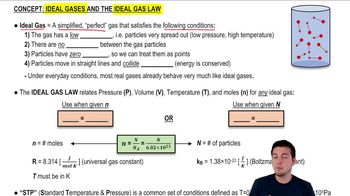
The Ideal Gas Law is a fundamental equation in thermodynamics that relates the pressure, volume, temperature, and number of moles of an ideal gas. It is expressed as PV = nRT, where P is pressure, V is volume, n is the number of moles, R is the ideal gas constant, and T is temperature in Kelvin. This law provides a basis for understanding the behavior of gases under various conditions.
Recommended video:
Guided course
07:21
Ideal Gases and the Ideal Gas Law

Temperature Conversion

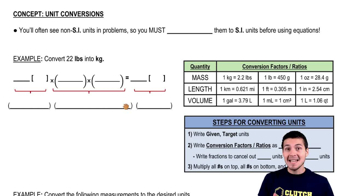
Temperature conversion is the process of changing a temperature value from one scale to another, such as from Celsius to Kelvin. In thermodynamics, Kelvin is the standard unit of temperature, where 0 K is absolute zero. The conversion from Celsius to Kelvin is done by adding 273.15 to the Celsius temperature, which is crucial for calculations involving gas laws and thermodynamic equations.
Recommended video:
Guided course
07:46
Unit Conversions