Join thousands of students who trust us to help them ace their exams!
Multiple Choice
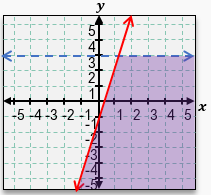
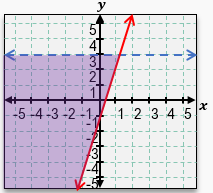
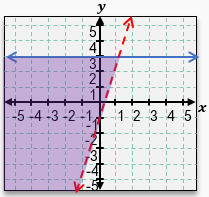
Which of the following graphs accurately represents the solution to the system of inequalities?
A
B
C
0 Comments
Verified step by step guidance
1
Identify each linear inequality in the system. For example, inequalities might look like \(y \leq 2x + 3\) or \(y > -x + 1\).
Rewrite each inequality in slope-intercept form, \(y = mx + b\), if it is not already, to make graphing easier.
Graph the boundary line for each inequality. Use a solid line if the inequality is \(\leq\) or \(\geq\), and a dashed line if it is \(<\) or \(>\).
Determine which side of the boundary line to shade by choosing a test point (often the origin \((0,0)\) if it is not on the line) and checking if it satisfies the inequality.
Shade the region that satisfies each inequality. The solution to the system is the overlapping shaded region where all inequalities are true.


 Verified step by step guidance